Stratifying Mortality Risk Using Prescription Drug Information

Predictive models and life insurance
Munich Re assessed the Milliman Rx Risk Score, a predictive modeling tool developed and owned by Milliman that assesses mortality risk using an individual’s prescription drug information. Insurers considering prescription-drug-based scores should begin with a retrospective validation study on their own experience data. Munich Re can assist carriers with the retrospective study, advise on changes to mortality assumptions and recommend ways to incorporate the scores to streamline the underwriting process.
Executive summary
The Milliman Rx Risk Score is a proprietary scoring algorithm that uses prescription drug history to predict the mortality risk of individuals relative to other individuals of the same age and gender. In 2017, Munich Re assessed Rx Risk Score 1.0 and determined the scores are predictive of mortality for the U.S. insurance applicant population. Recently, Milliman enhanced their Rx Risk Score by incorporating additional data and more sophisticated predictive modeling techniques to assign a score to each individual.
Milliman provided Munich Re with 25 million lives sampled from the U.S. general insurance applicant population which includes life, health, LTC, DI, final expense and Medicare supplement. Compared with the data used to develop the first Rx company-specific insured dataset to help assess the value of the Milliman Rx Risk Score; a company-specific insured population is not expected to have identical underlying characteristics as this insurance applicant population.
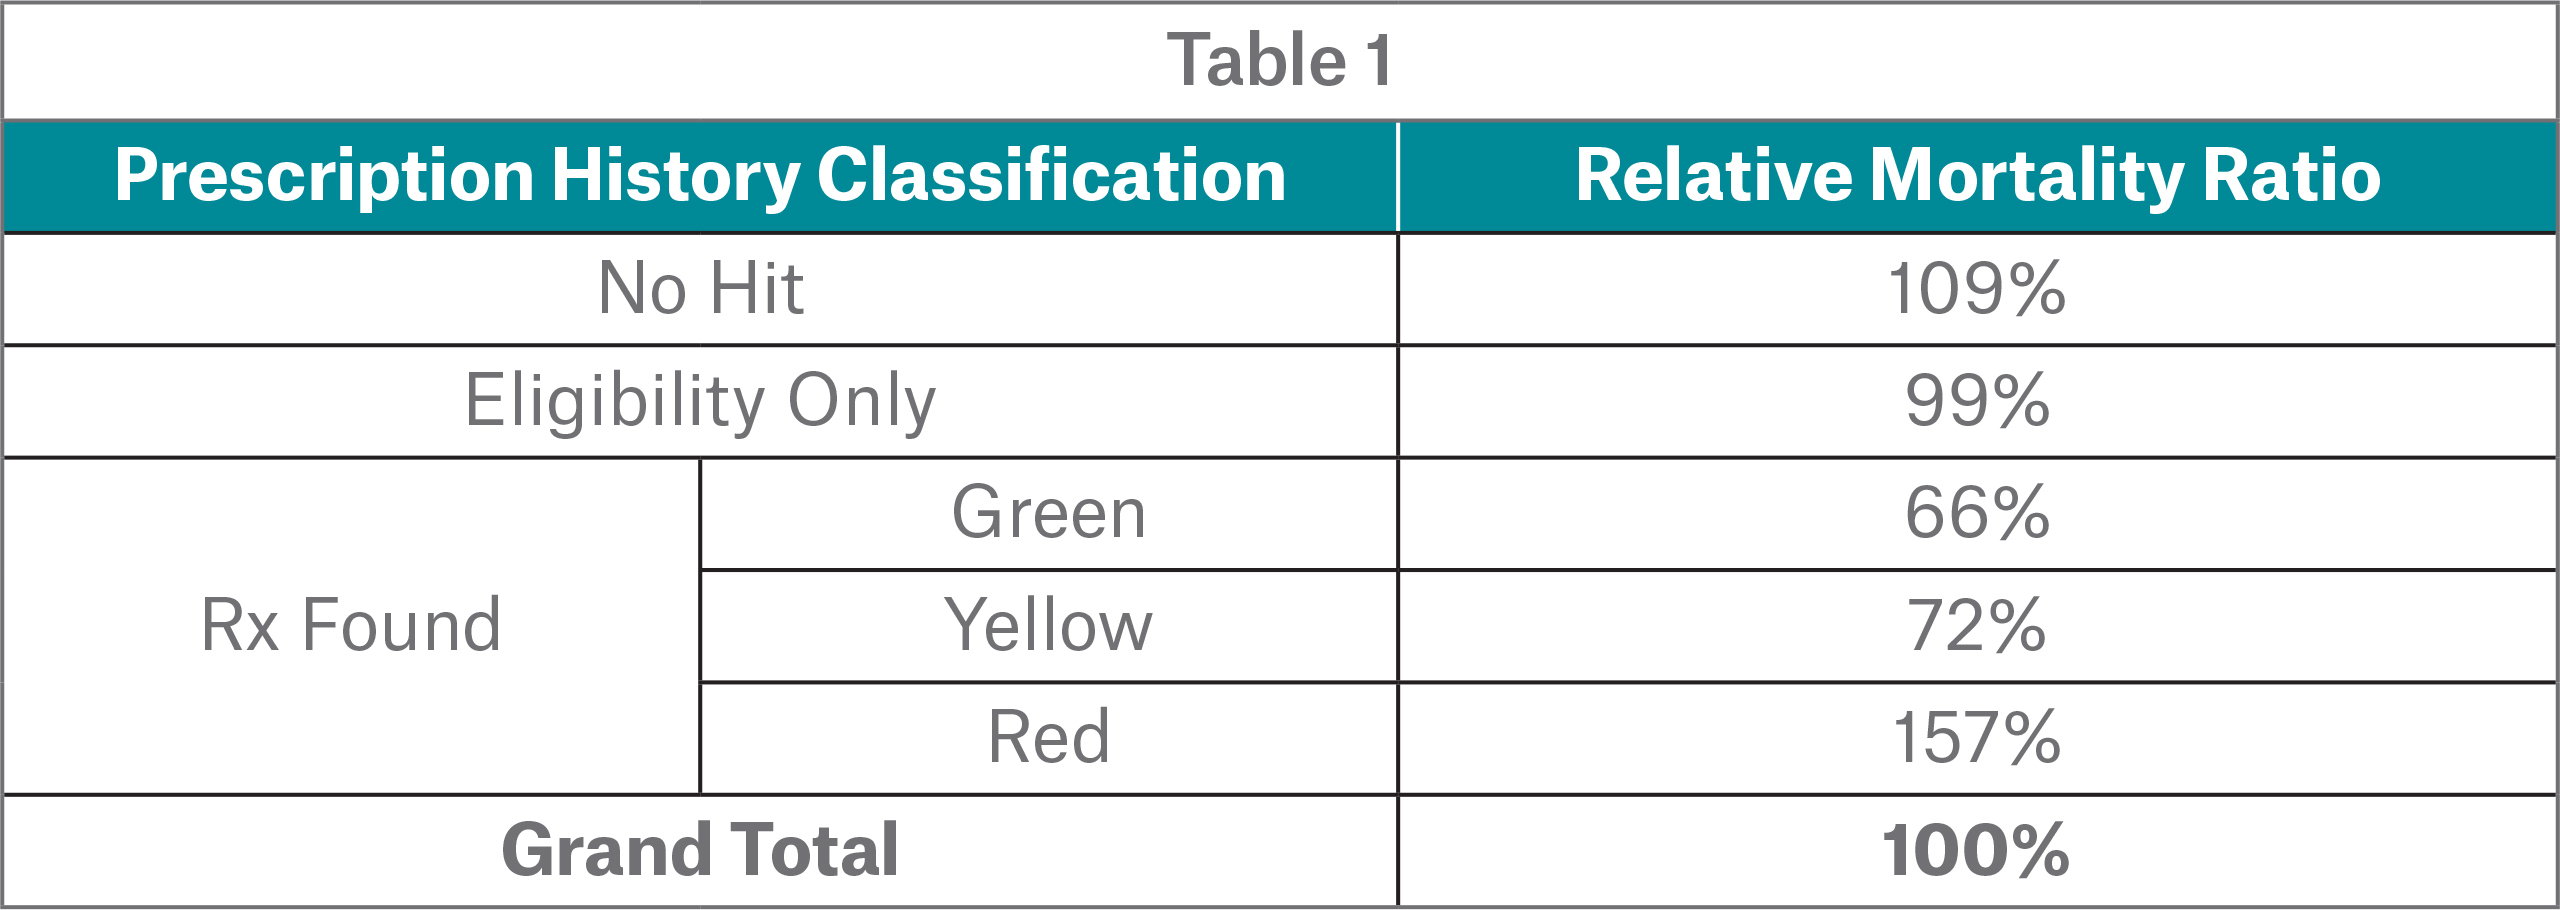
Life insurers interested in the Milliman Rx Risk Score should conduct a retrospective study in order to calibrate the tool to the carrier’s own underwriting paradigm. This process will help carriers balance the score with expected mortality with respect to their unique target markets, distribution channels, and other underwriting tools. Risk Score, the development of Rx Risk Score 2.0 is comprised of 12 million more lives, two more years of data with two additional years of duration, and double the number of deaths. Applicants who were not found in the prescription history query were classified as “No Hit” in the most severe drug priority field. Applicants who were found in the prescription history query, but with no prescription fills were classified as “Eligibility Only”.
Munich Re performed an analysis of Rx Risk Score 2.0 and confirmed it is predictive of mortality for the U.S. insurance applicant population. Munich Re recommends replicating the study on a company-specific insured dataset to help assess the value of the Milliman Rx Risk Score; a company-specific insured population is not expected to have identical underlying characteristics as this insurance applicant population.
Life insurers interested in the Milliman Rx Risk Score should conduct a retrospective study in order to calibrate the tool to the carrier’s own underwriting paradigm. This process will help carriers balance the score with expected mortality with respect to their unique target markets, distribution channels, and other underwriting tools.
Munich Re assessed the effectiveness of Milliman Rx Risk Score in stratifying the mortality risk using an individual’s prescription drug information.
Methodology
Munich Re assessed the effective-ness of the new Milliman Rx Risk Score in stratifying the mortality risk profile of a pool of 25 million applicants with entry ages 0 - 100. Each life entered the study between the first quarter of 2005 and the last quarter of 2016. Deaths were sourced from the Social Security Death Master File and third party proprietary databases. The study population is comprised of 468,491 deaths out of 104 million exposed life-years.
The expected mortality basis was taken from the 2015 VBT primary select and ultimate ANB tables split by age and gender with a 1 percent mortality improvement. We did not have the smoking status of each applicant, so we used an 85 percent non-smoker/15 percent smoker blend of the smoker distinct tables.
Munich Re completed additional analyses of relative actual to expected ratios (A/E) by various factors (e.g., age, gender, duration, line of business, most severe drug priority, and clinical mortality rule flag) to assess whether the mortality risk stratification by the Milliman Rx Risk Score is influenced by those factors.
Overall Results
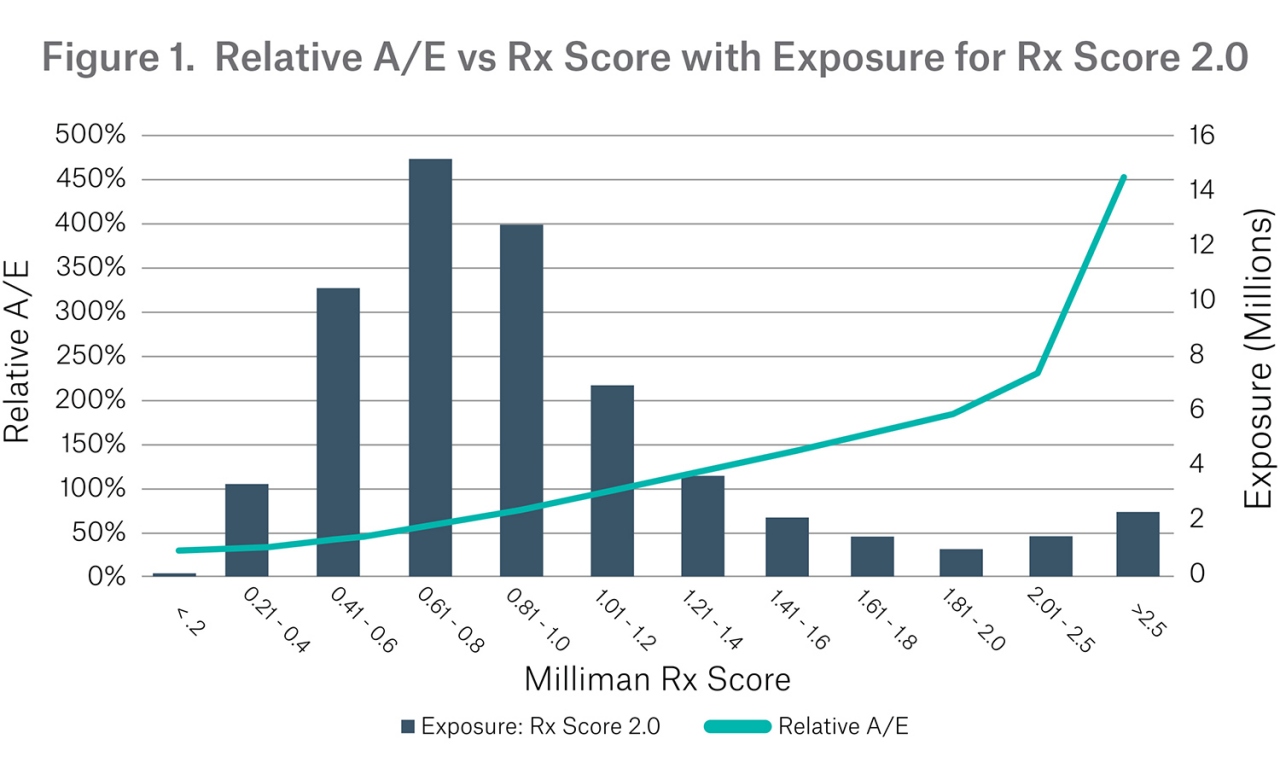
Figure 1 is a high-level overview validating the Milliman Rx Risk Score 2.0’s ability to stratify mortality risk. Lives with higher scores have higher mortality risk, while lower scores correspond with lower mortality risk.
Exposure
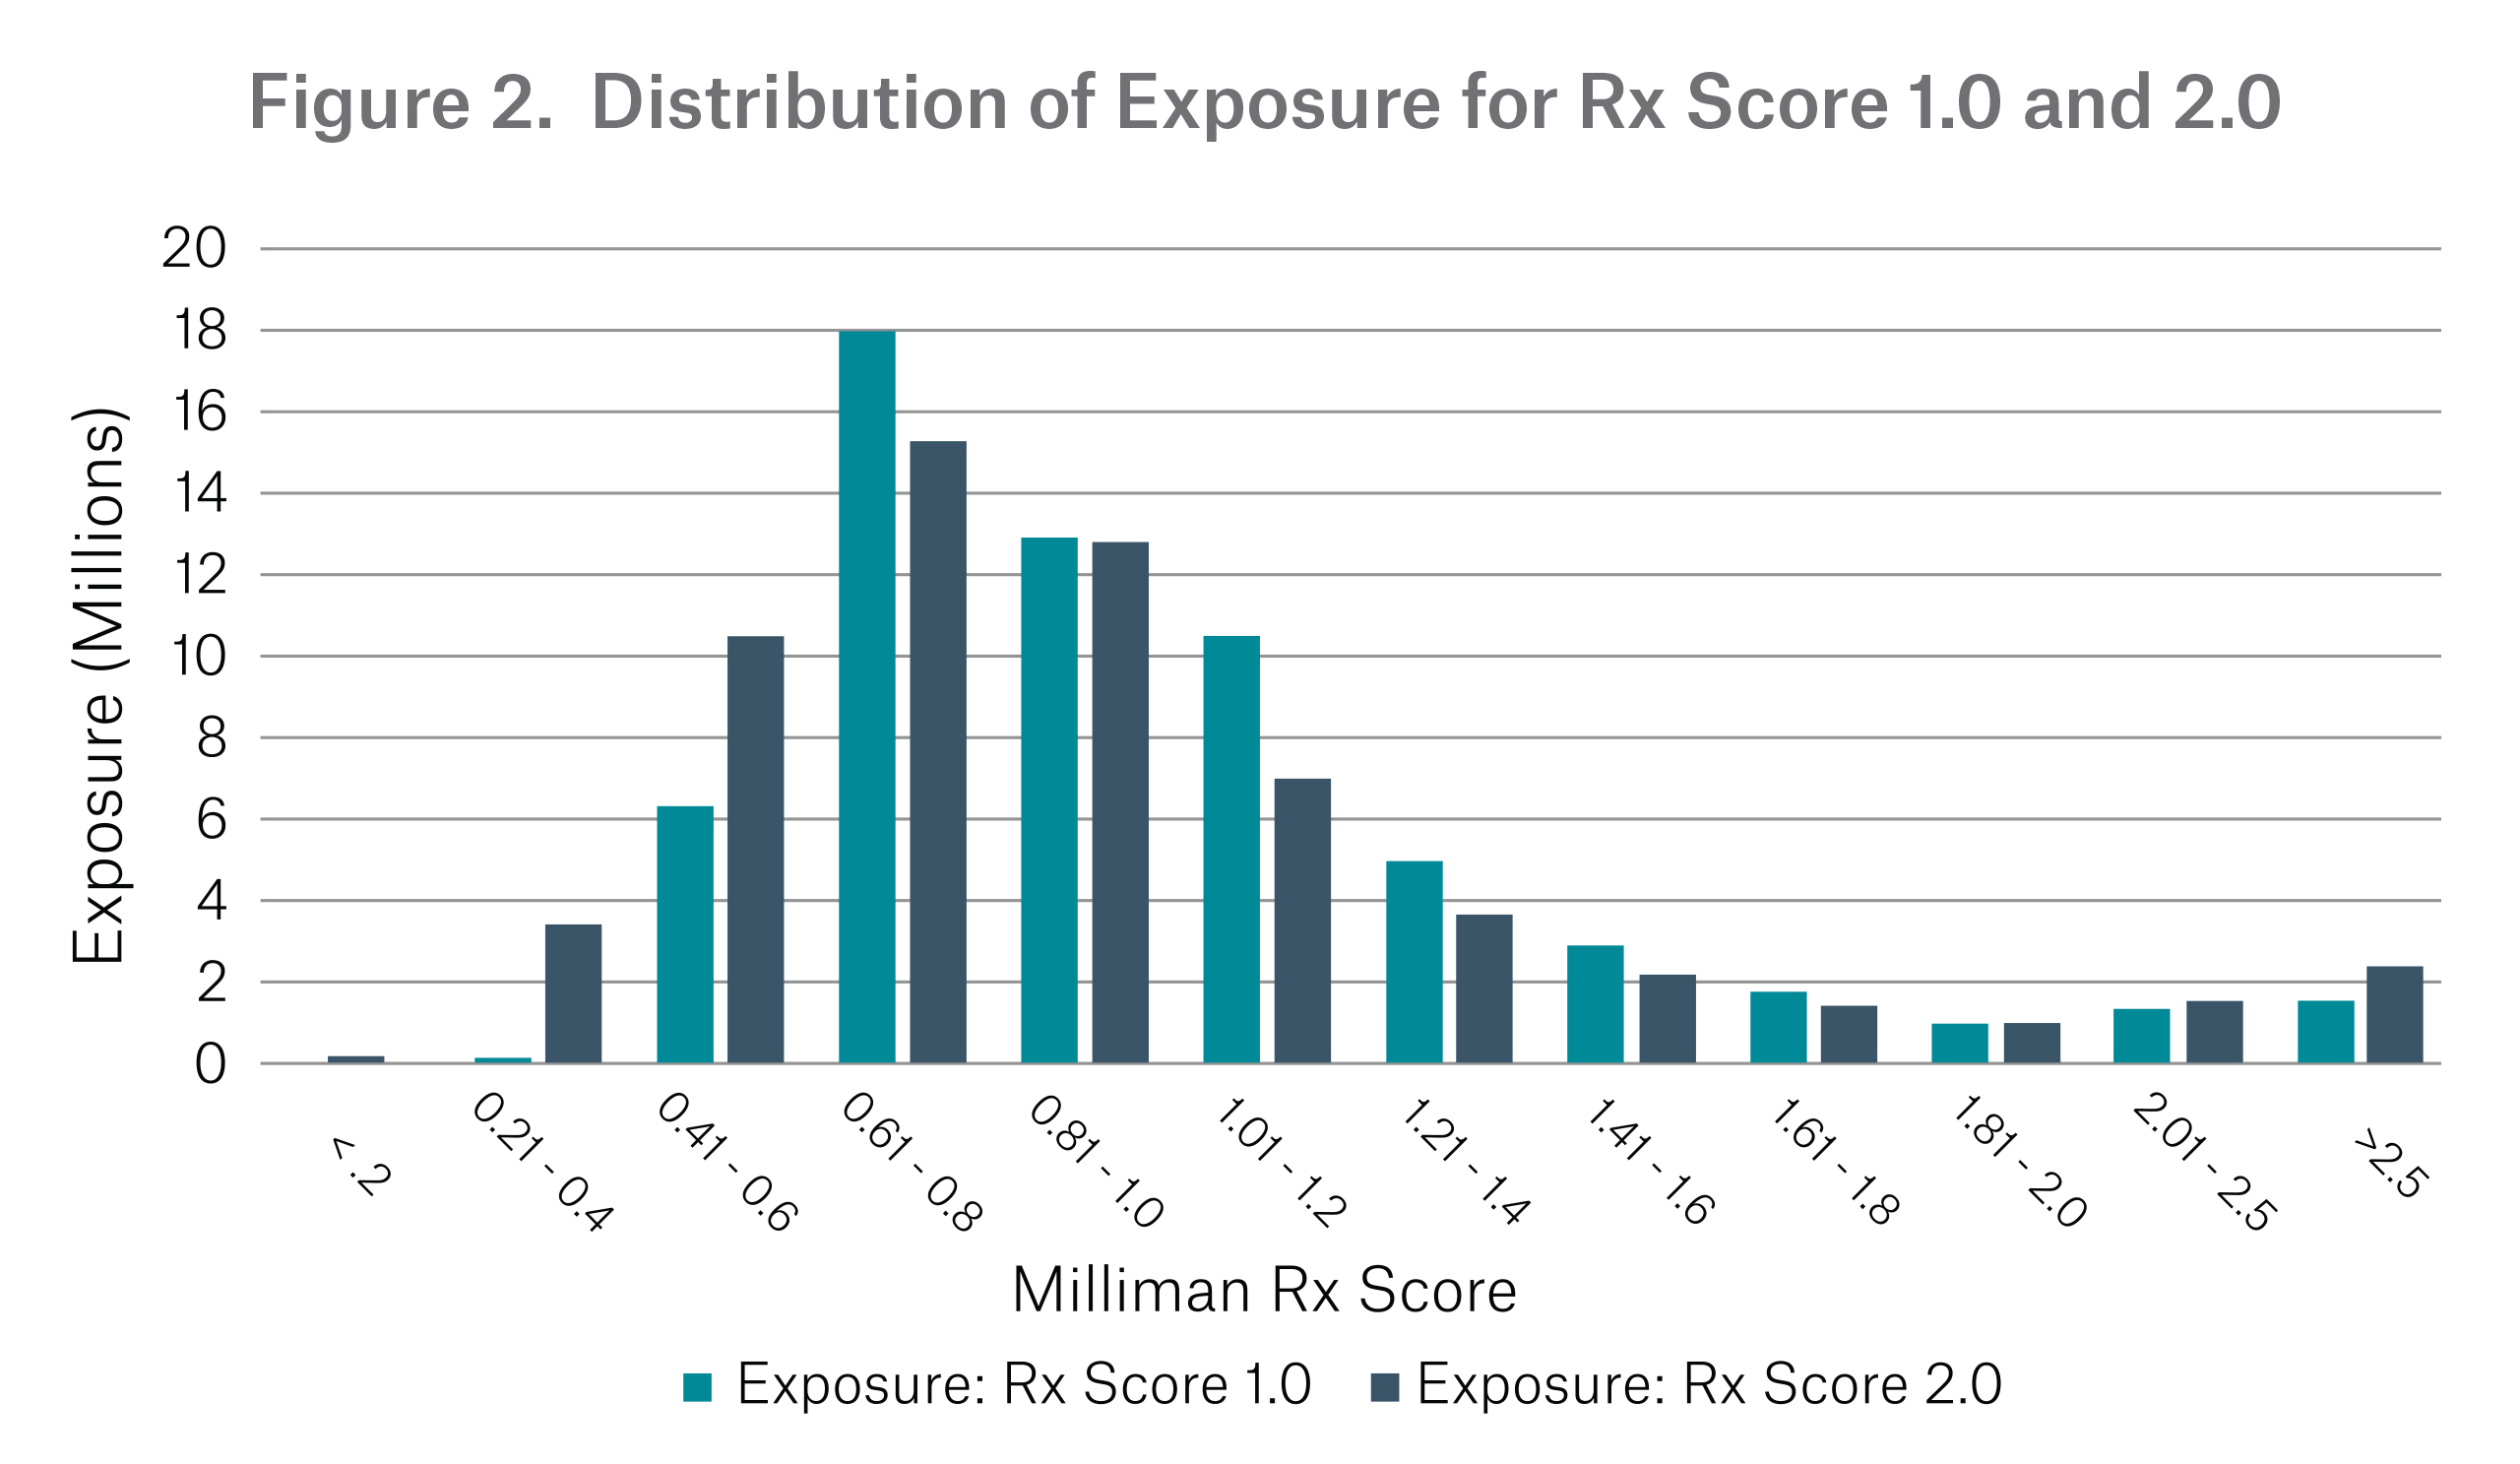
Figure 2 shows the distribution of risk scores for the exposures used to develop Risk Score 1.0 and Risk Score 2.0. We observe that there is a wider distribution of exposures in Risk Score 2.0: there are more lives that have a risk score greater than 2.5 and more lives that have a risk score less than 0.6.
This means that Risk Score 2.0 allows carriers to identify more lives with better mortality.
Age
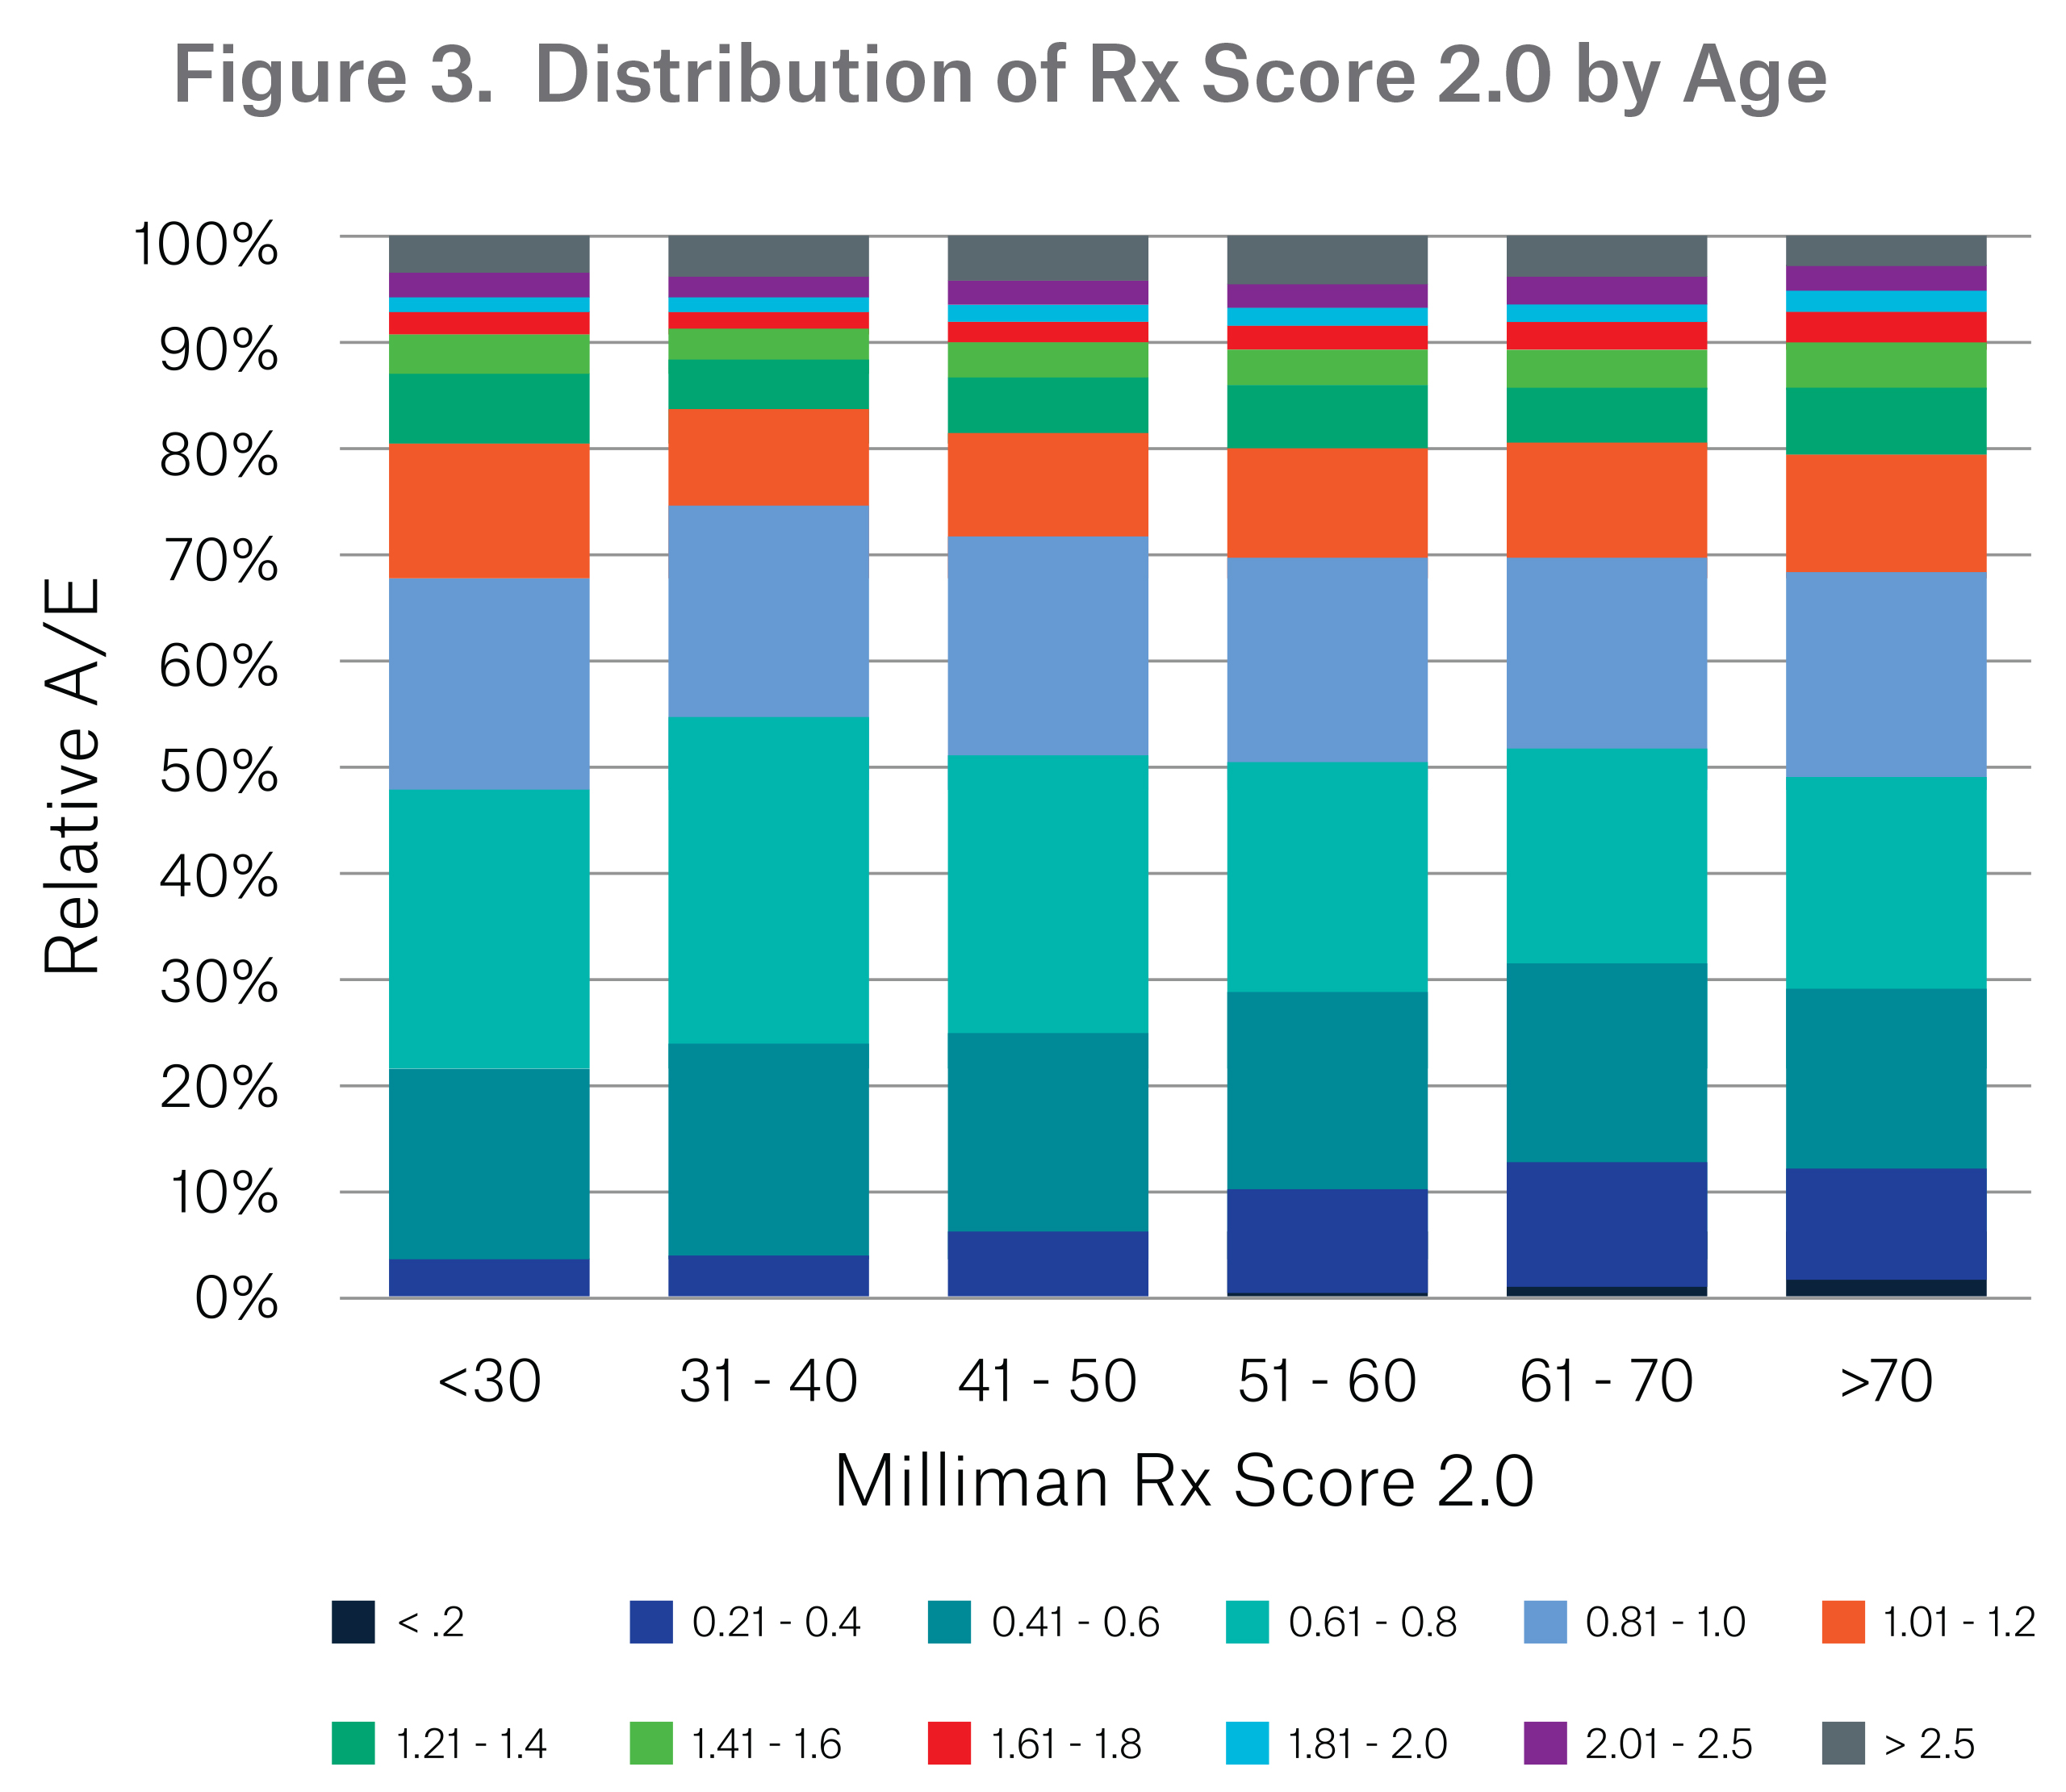
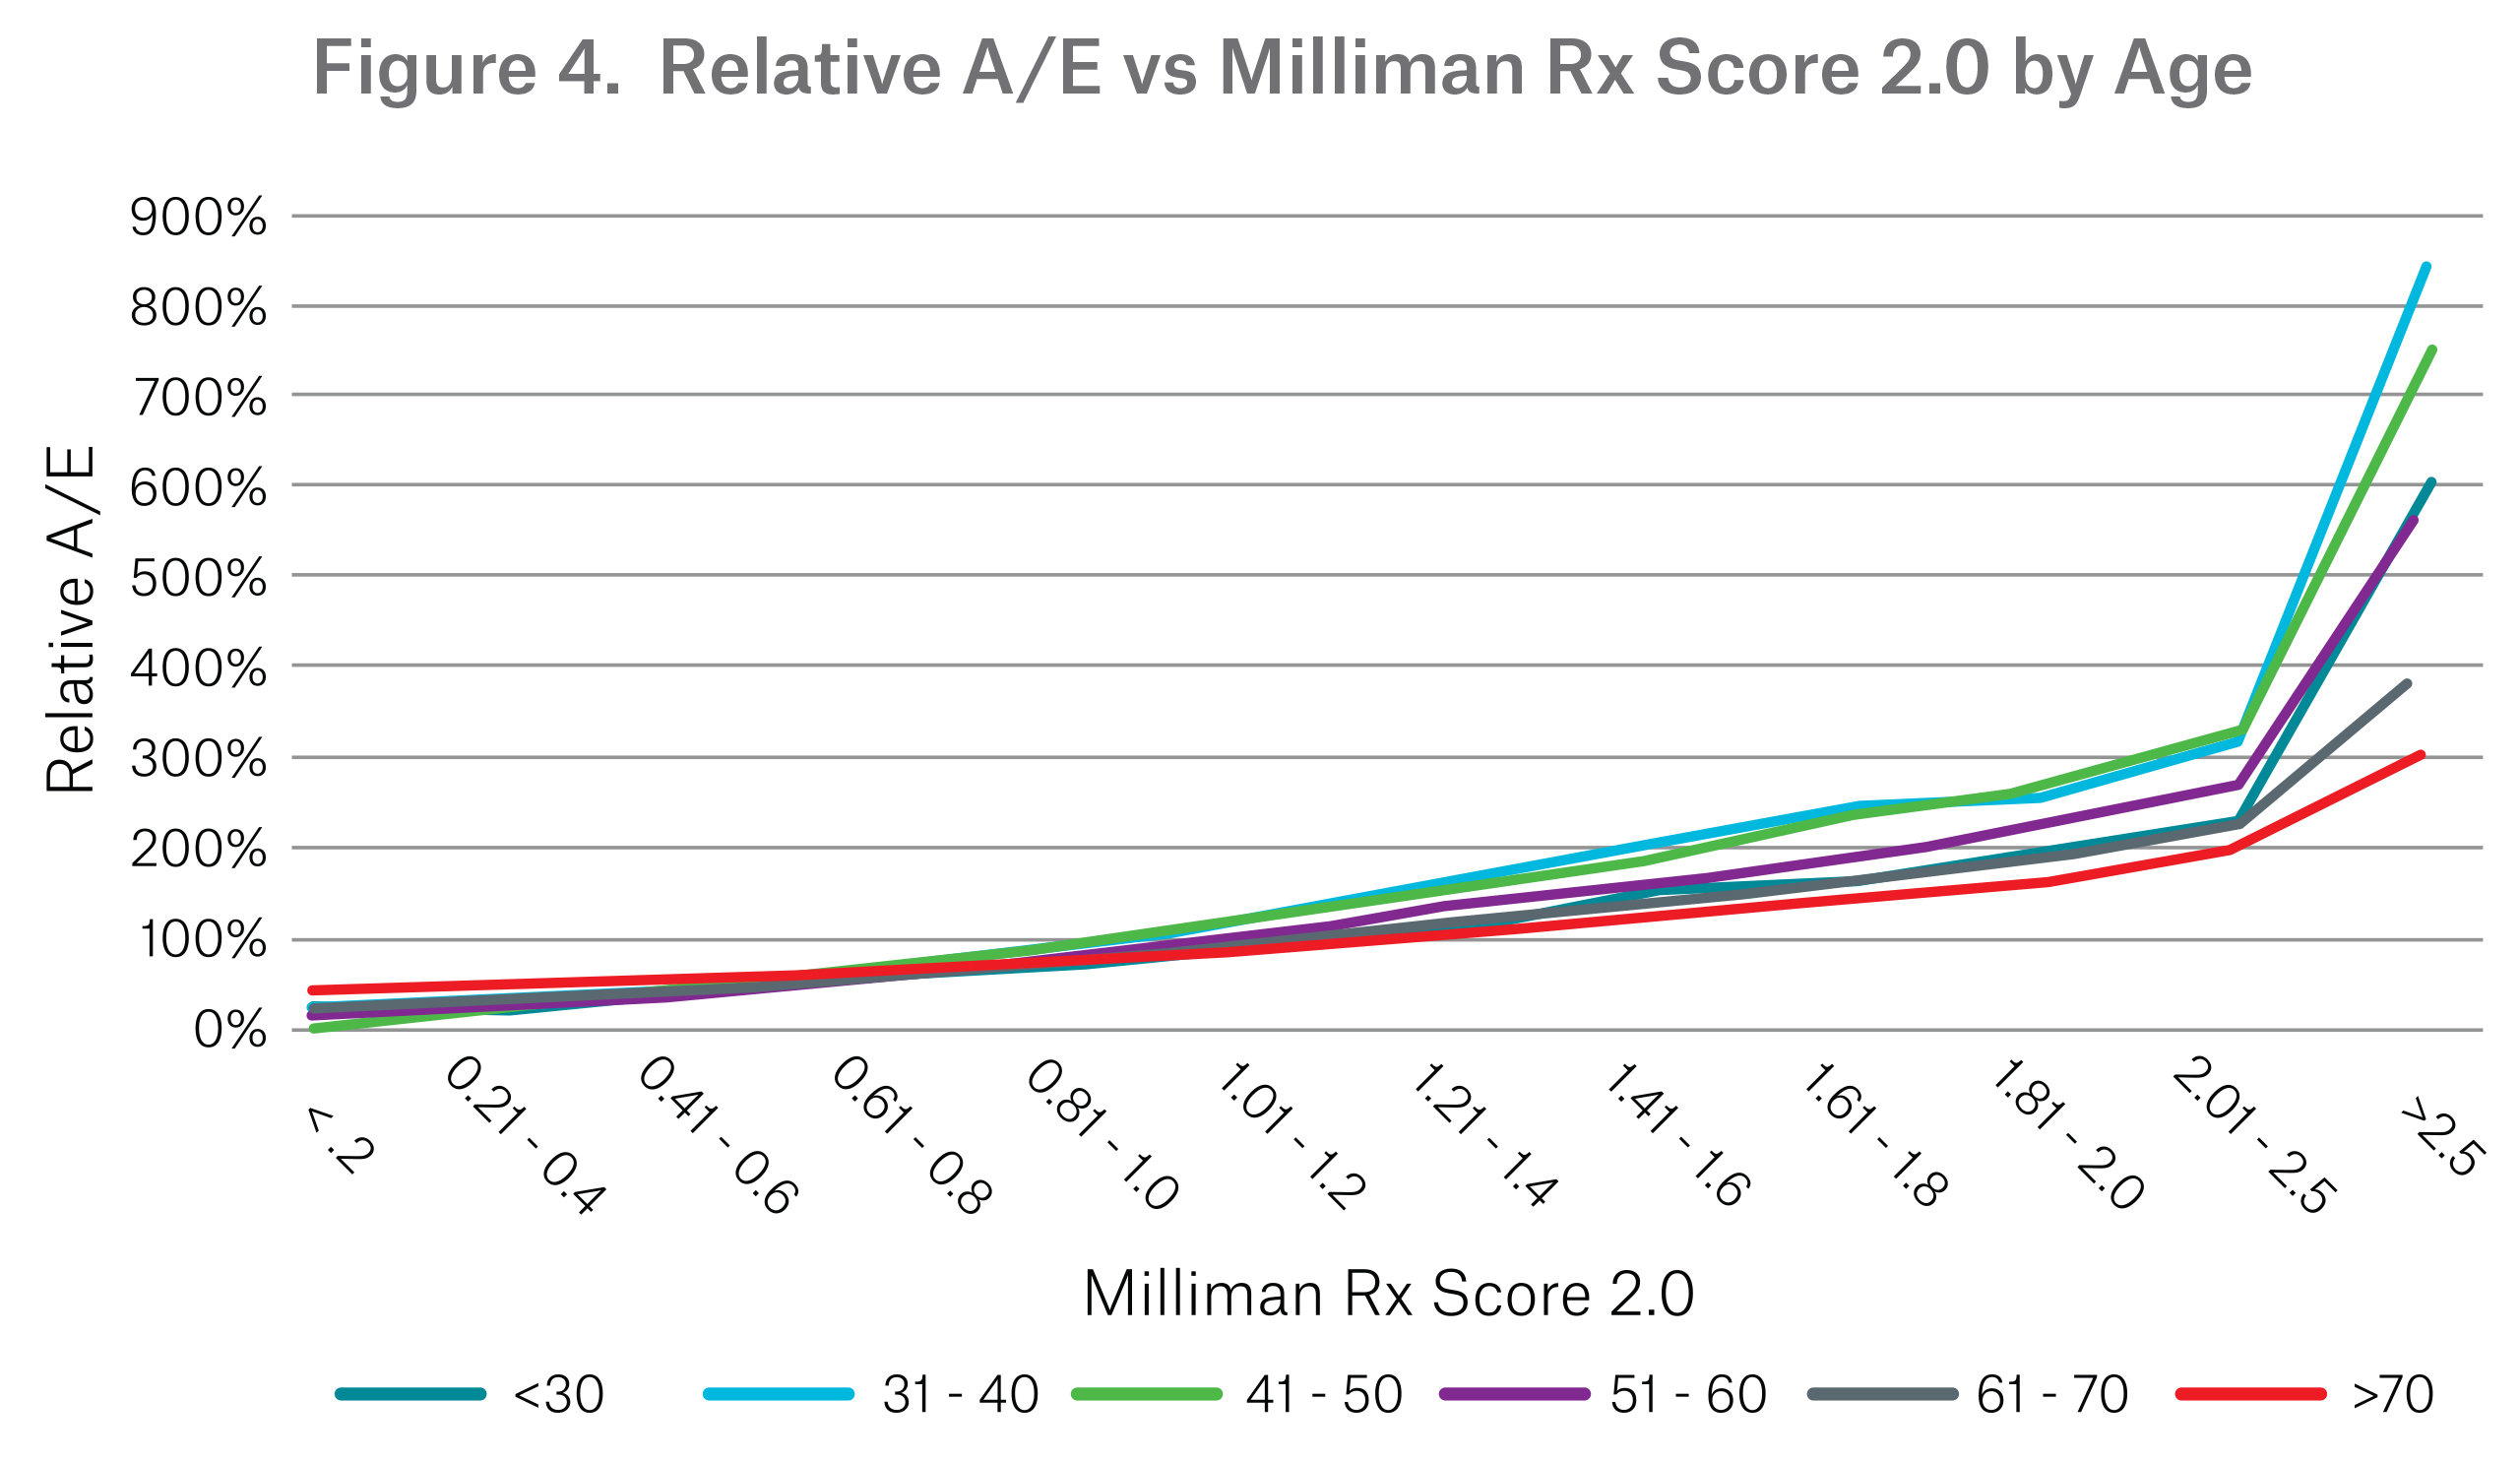
Figure 3 shows the distribution of the Milliman Rx Risk Scores within each age group (excluding Eligibility Only and No Hit); the Rx Risk Score is controlled for age. With Risk Score 1.0, the proportion of low scores increases as age increases and flattens out after age 70.
With Risk Score 2.0 we see that the distribution of scores is about the same across age groups.
Duration
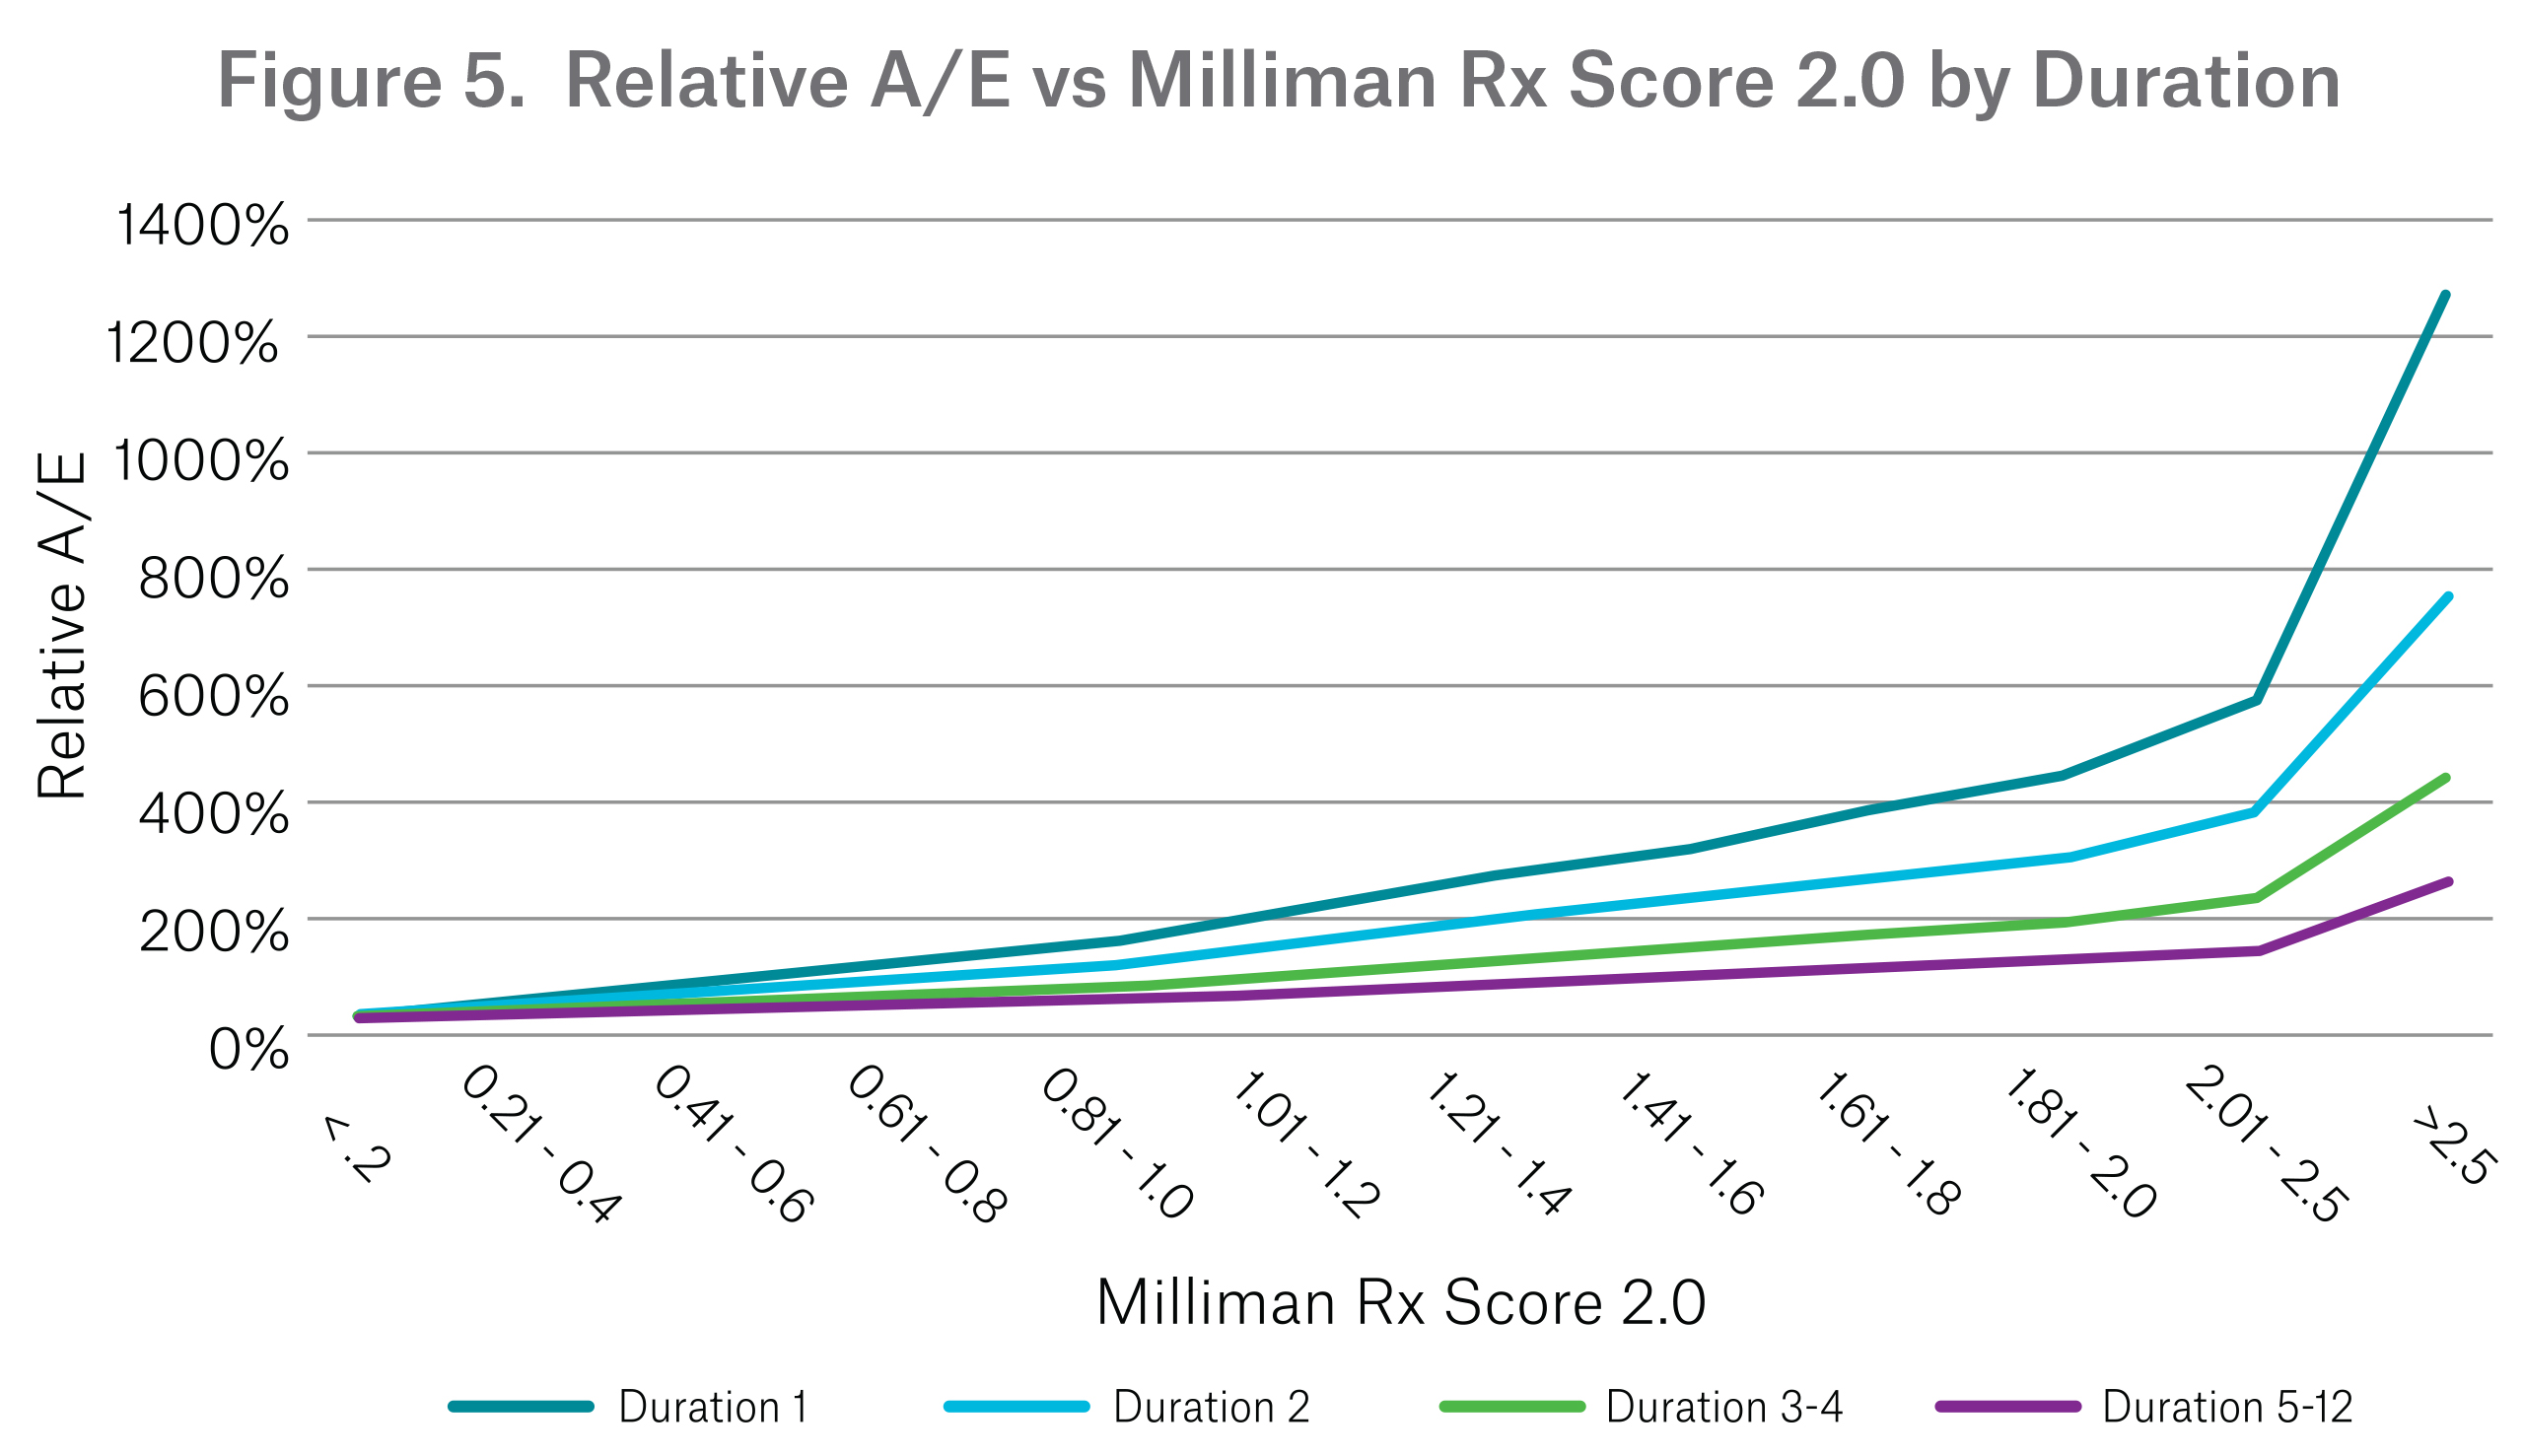
From Figure 5, we can see that the effectiveness of the Milliman Rx Score is consistent for varying durations. The difference in mortality risk between the durations is more evident for higher scores. High scoring lives have a higher mortality risk in the early durations, which then decreases significantly in later durations.
Line of Business
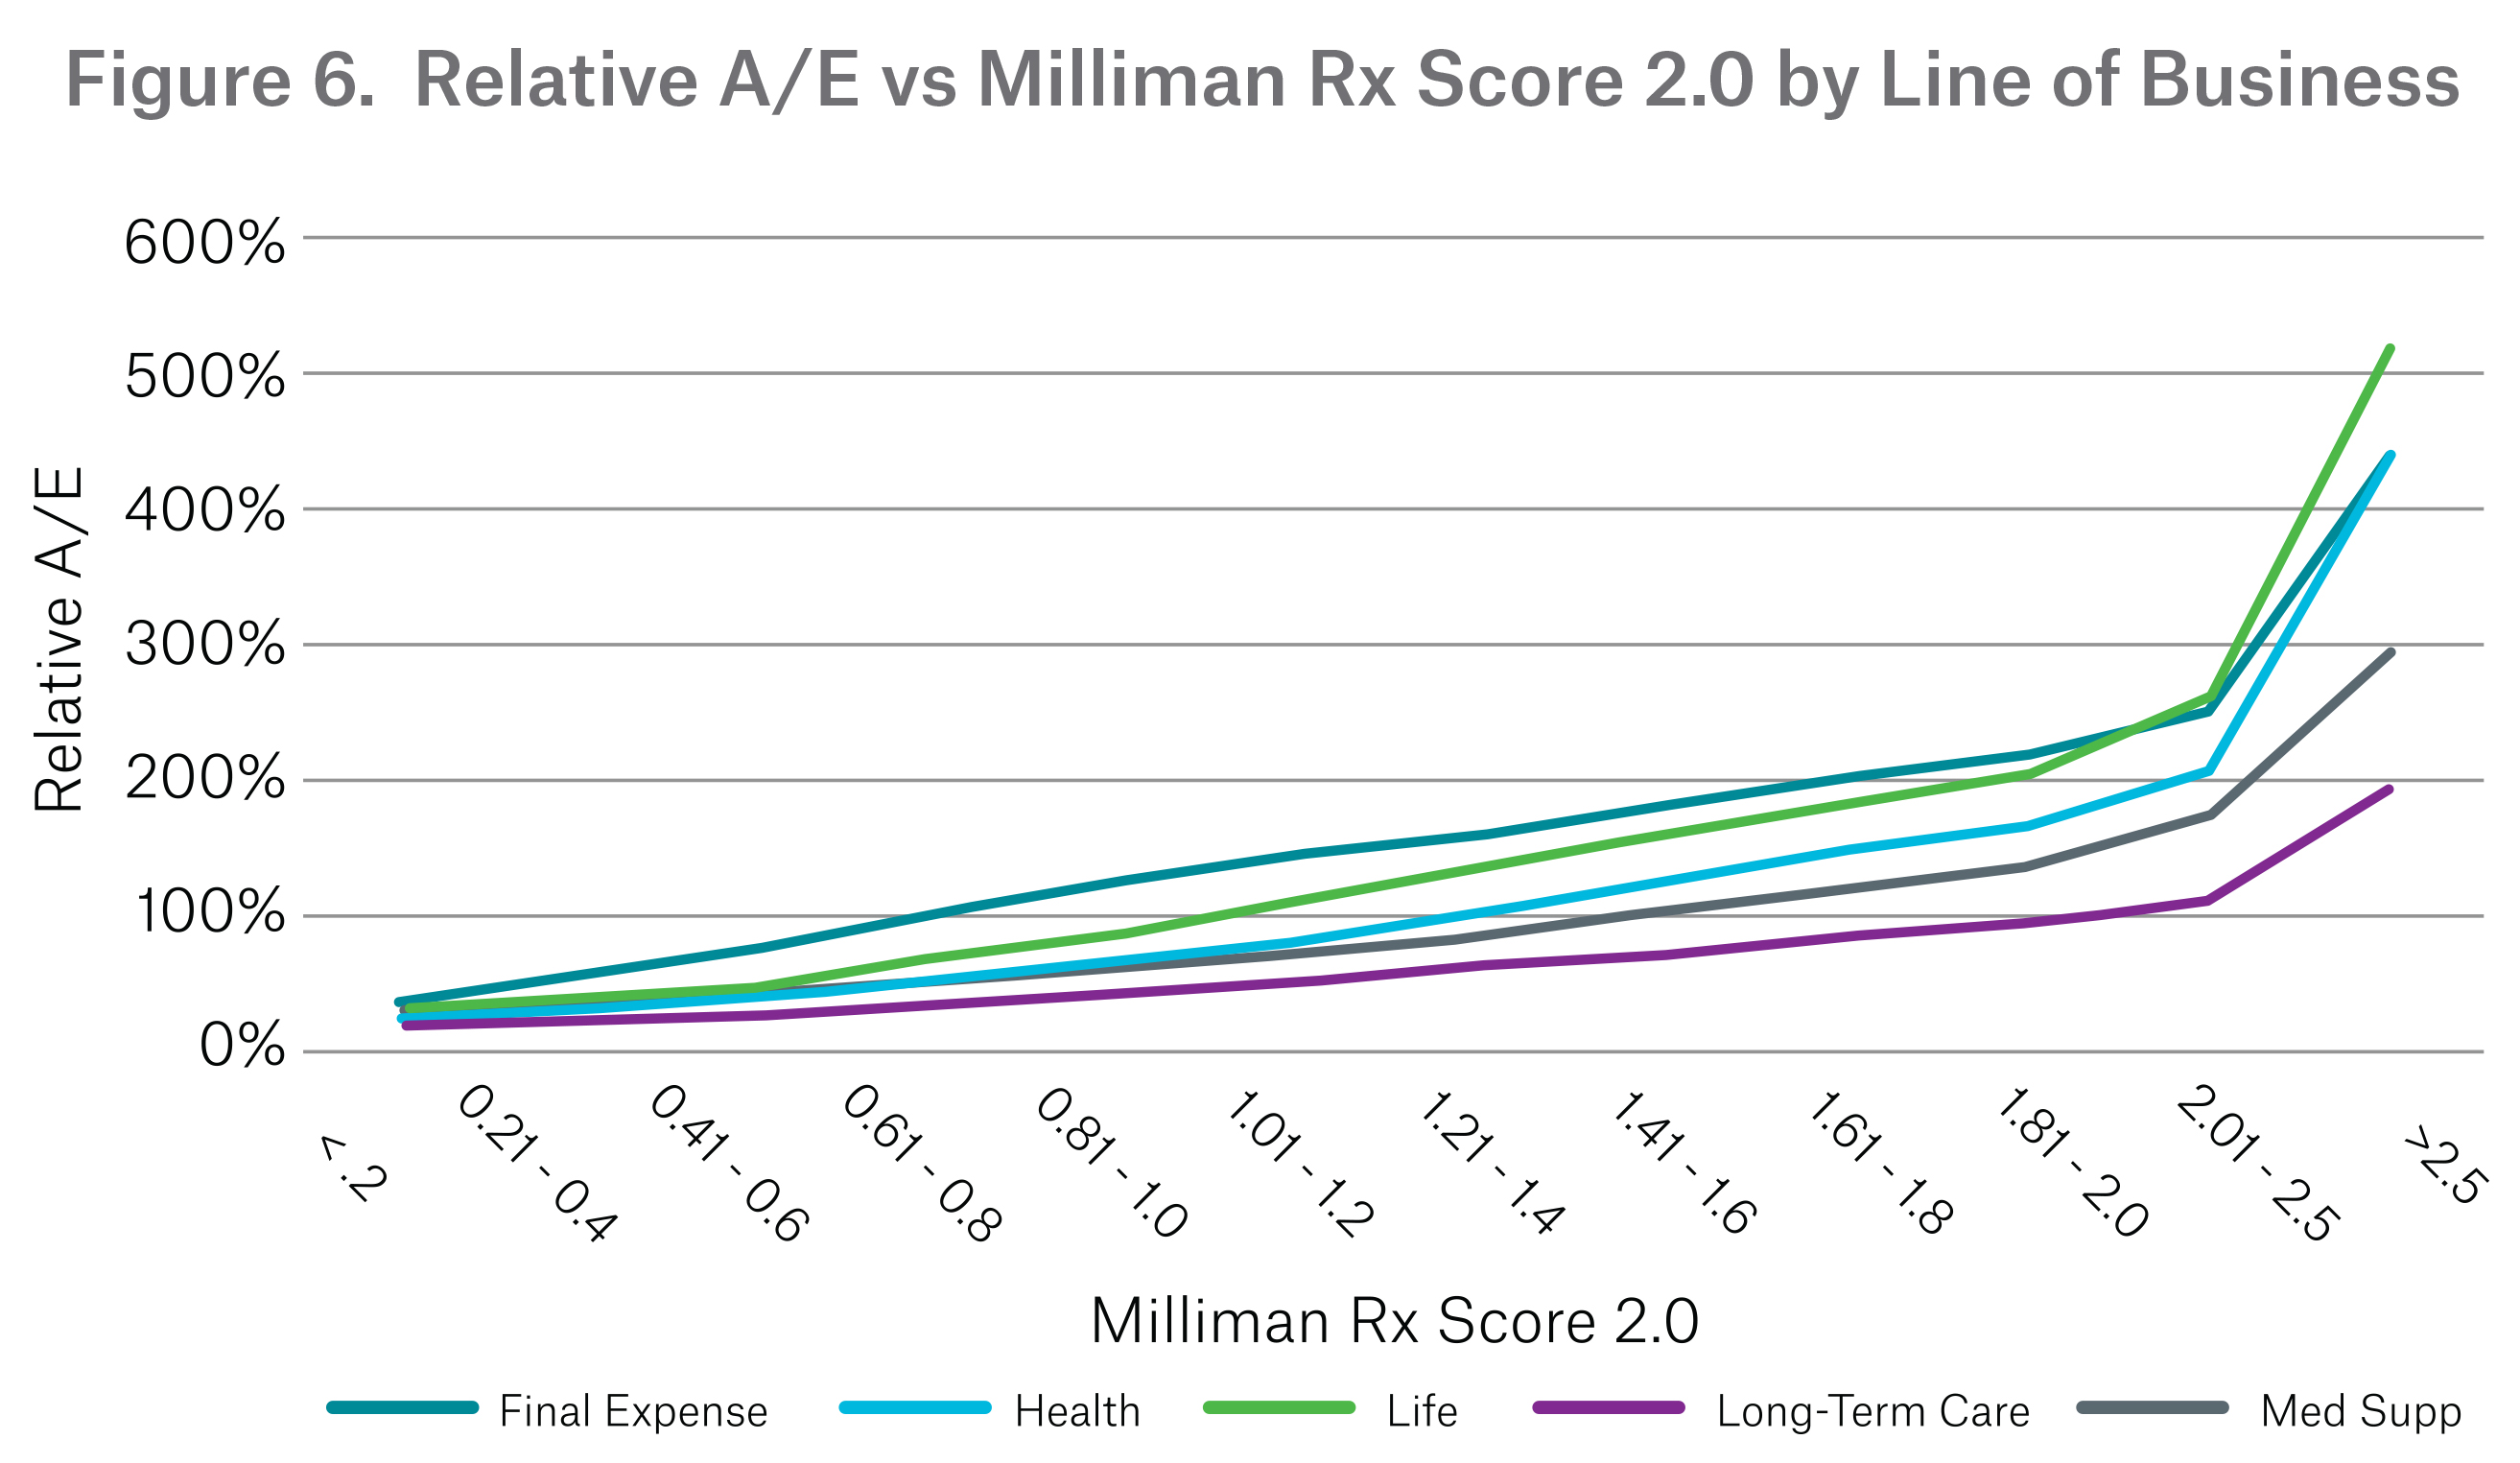
The Milliman Rx Risk Score stratifies mortality risk across different lines of business as shown in Figure 6.
Most Severe Drug Priority
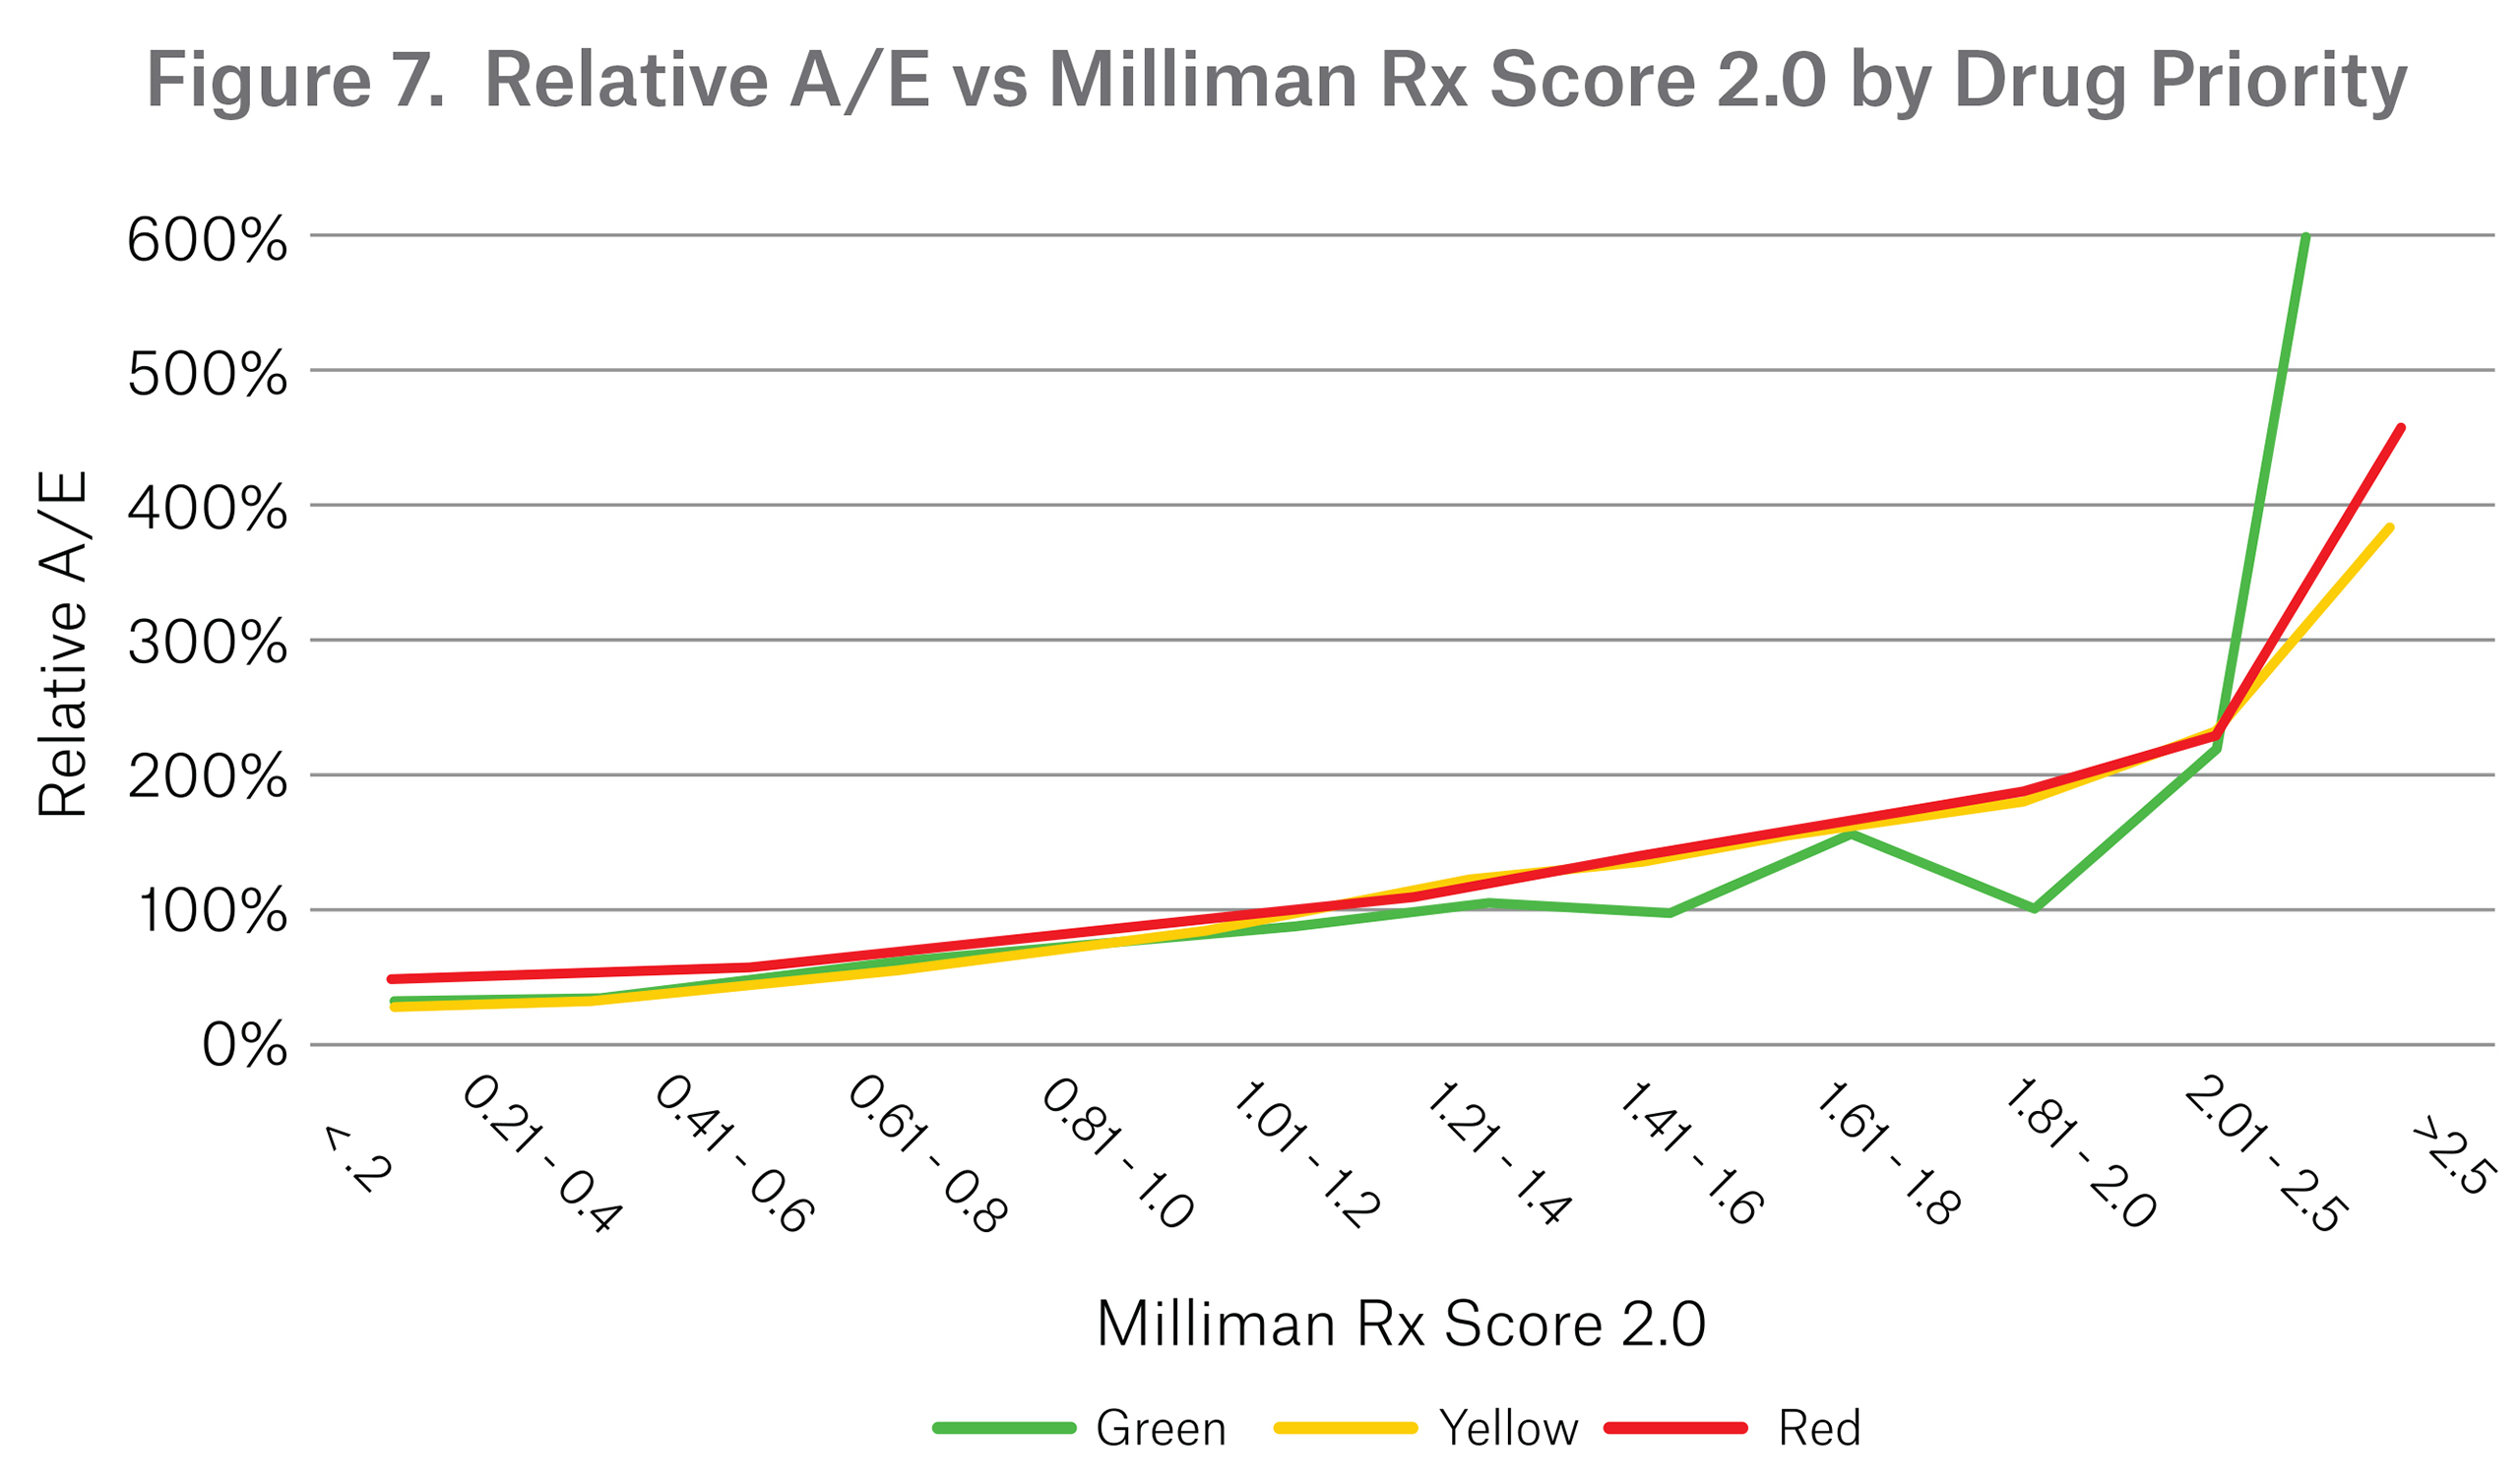
The study population (excluding Eligibility Only and No Hit) were assigned one of three “most severe drug priority” ratings – green, yellow, and red. A green rating indicates the applicant has a prescription history with only drugs corresponding to low mortality risk. Similarly, a yellow rating indicates the applicant has a prescription history with drugs corresponding to moderate mortality risk or lower. A red rating indicates the applicant’s prescription history contains a drug corresponding to high mortality risk.
As illustrated by Figure 7, the Milliman Rx Risk Score successfully segments mortality risk for applicants with red and yellow most severe drug priority ratings. We observe the mortality risk is significantly higher for green ratings for scores greater than 2.5; this is because there is a very low number of deaths in this group (only two deaths).
Because the Milliman Rx Risk Score uses a multi-variate approach to incorporate information from the Rx history, it provides additional mortality segmentation, especially for higher mortality risks, over using the green/yellow/red drug classification alone.
Clinical Mortality Rule Flag
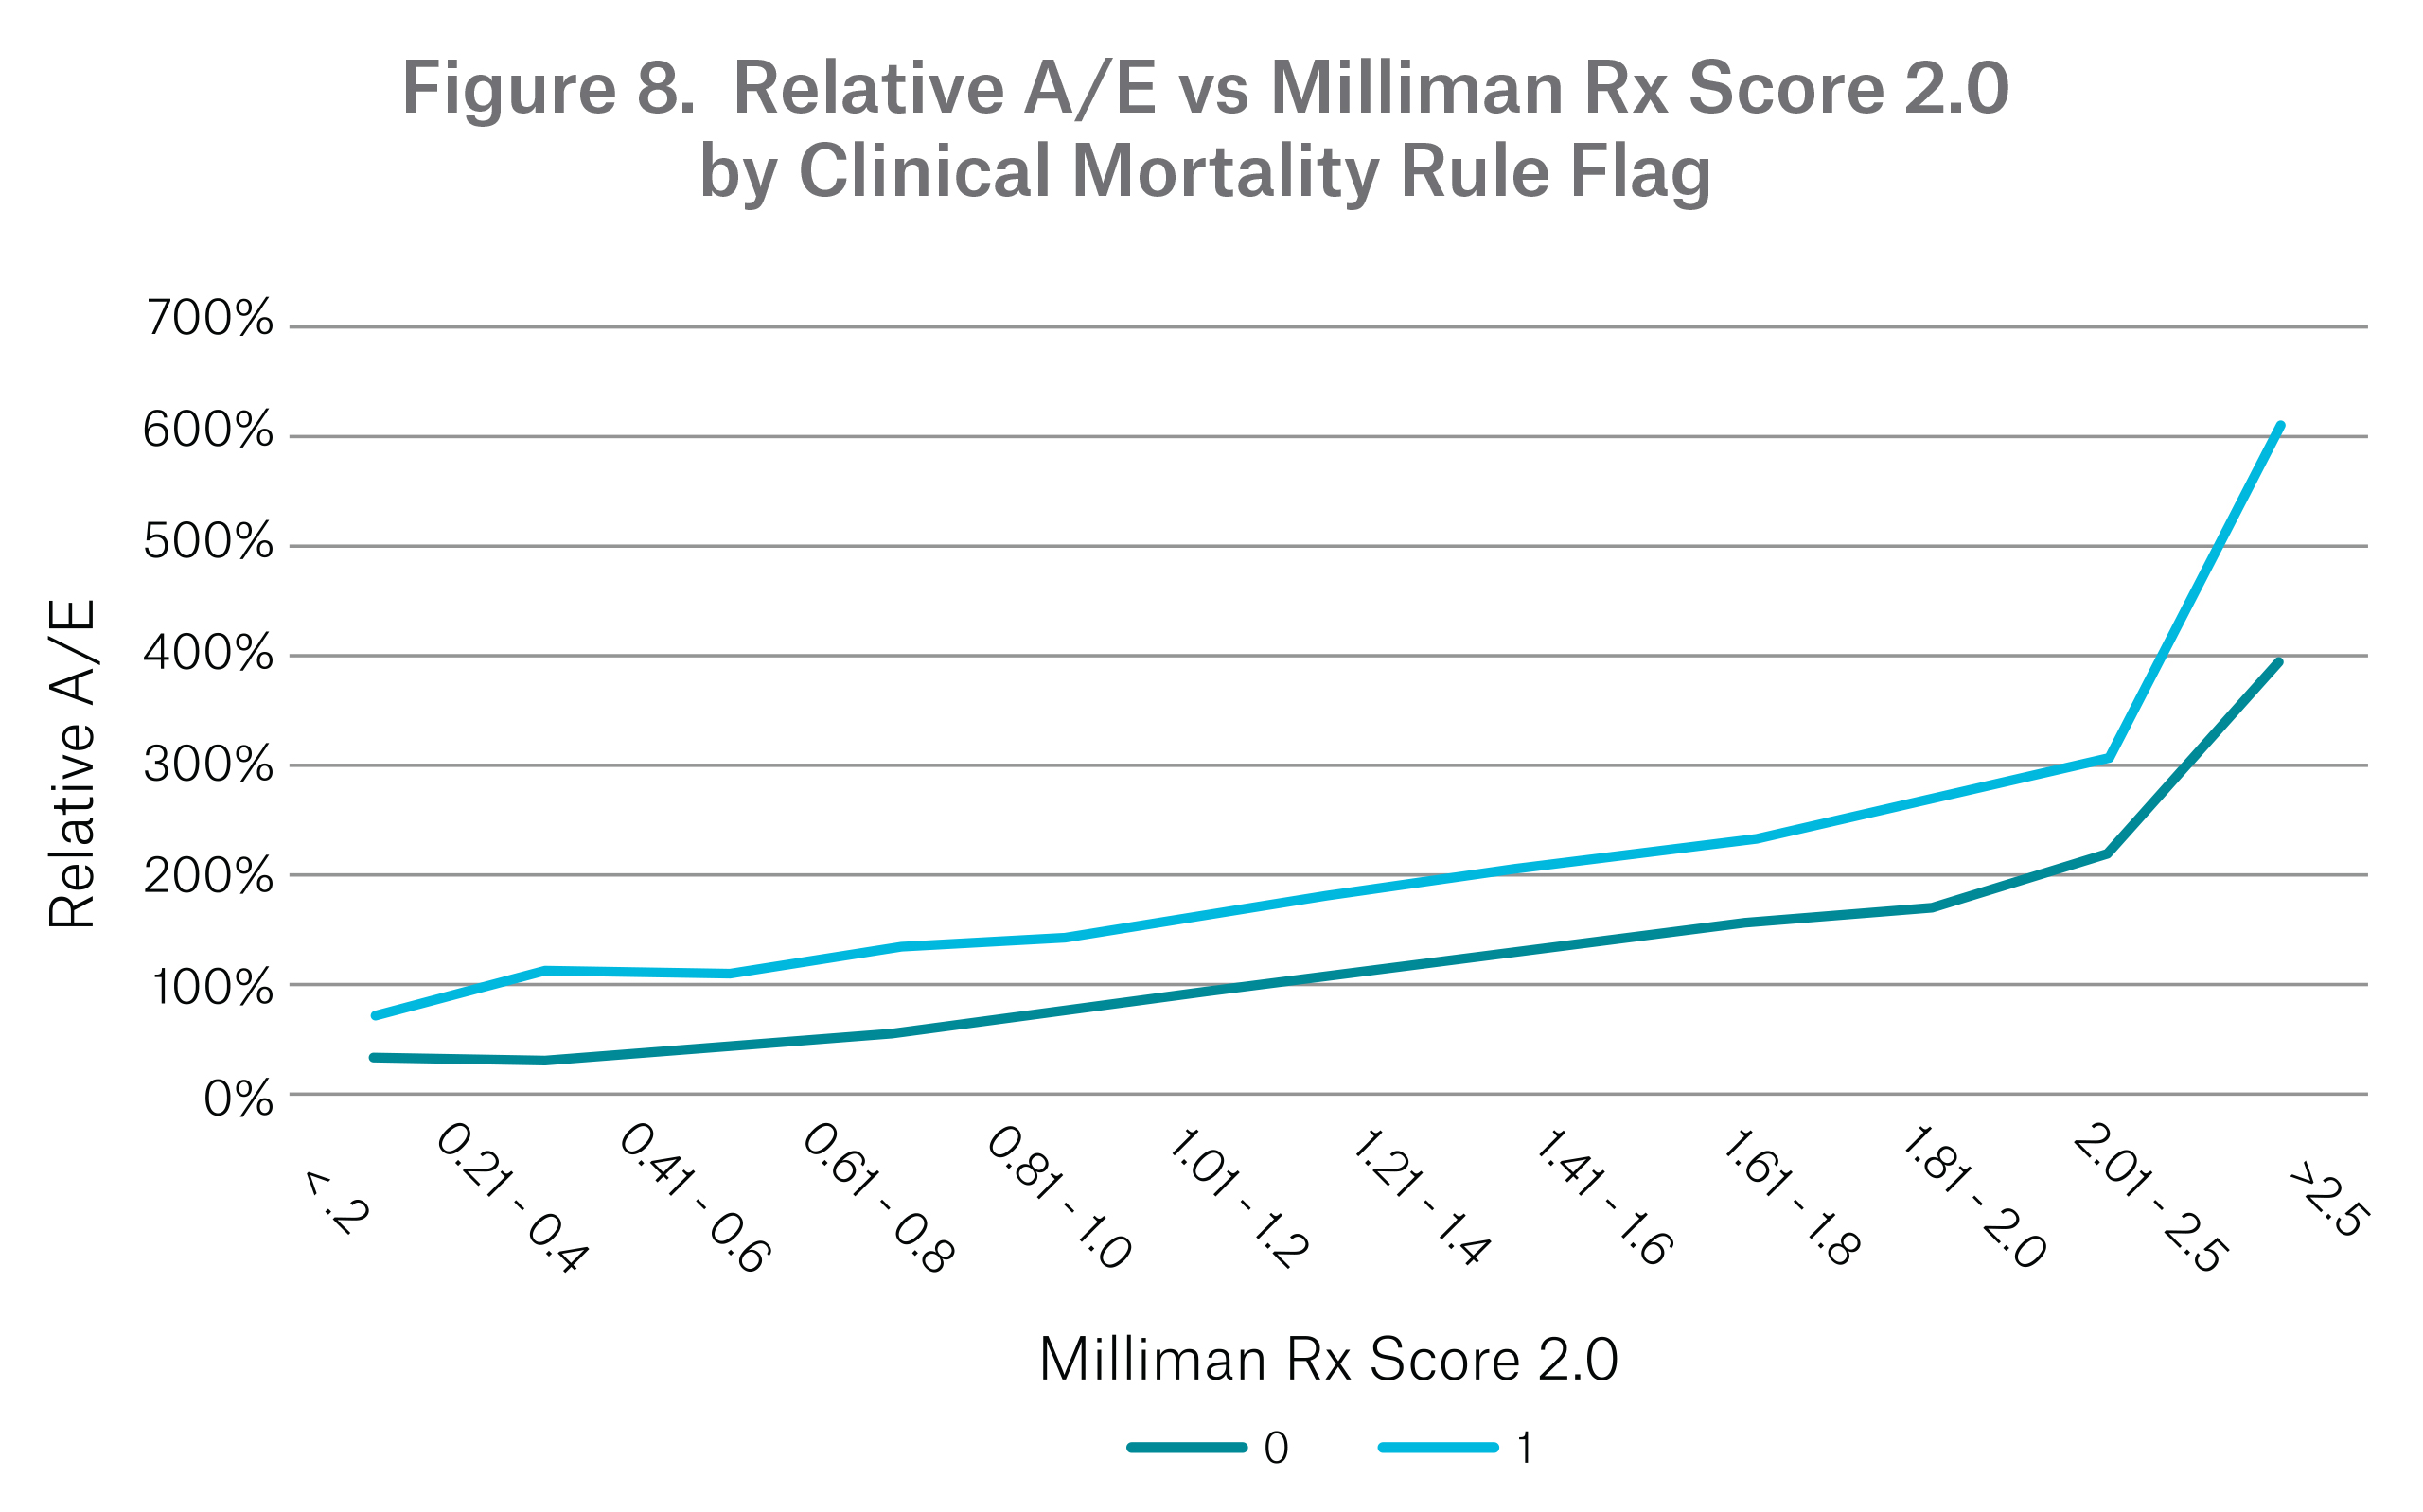
Milliman has incorporated a clinical mortality rule to flag applicants (excluding Eligibility Only and No Hit) who are taking medication for a condition associated with adverse mortality. This is a condition-based flag that can be useful when there is little data available or when evaluating new drugs. The rules can be customized for each company. In this study, 2 percent of all applicants have a clinical mortality flag of 1 while 3 percent of applicants with an Rx Score have a clinical mortality flag of 1.
Figure 8 demonstrates the mortality risk segmentation of the Milliman Rx Score by the clinical mortality rules flag. From the chart, it can be observed that the population of lives where the clinical mortality rule flag equals 1 has a higher mortality risk for all scores compared to the rest of the study population where the flag equals 0.
Summary
Munich Re concludes the Milliman Rx Risk Score 2.0 is an effective predictor of mortality for the U.S. insurance applicant population. The Milliman Rx Risk Score 2.0 stratifies mortality risk across multiple attributes and successfully isolates high risk applicants for all lines of business. It is especially effective at identifying high mortality risk at earlier durations. Furthermore, mortality risk segmentation is effective across all ages, even for older applicants who are more prone to require severe drug prescriptions. As such, the Milliman Rx Risk Score is not simply a measure of the severity of the applicant’s drug history. The score might be particularly effective in identifying high mortality risk when little other medical data is available, for example, in simplified issue programs. clinical mortality rules can further segment mortality to flag individuals who are taking prescriptions for conditions with higher mortality risk and these rules can be customized to fit the experience of an individual carrier. Finally, a company-specific insured population is not expected to have identical underlying characteristics to this insurance applicant population; we recommend each carrier perform a retrospective study to best assess the value and application of the Milliman
Rx Risk Score.
Printer-friendly version
Contact the Author:

Newsletter
properties.trackTitle
properties.trackSubtitle


