Introduction
An analysis of cause-specific mortality can shed light on variations in mortality patterns across sub-populations of an individual life insurance portfolio. These insights inform future mortality projections such as mortality improvement assumptions. The complex nature of mortality risk, especially for insured lives that are subject to the rigorous process of life underwriting, poses a challenge in understanding the likelihood of one cause of death over another. Some patterns, such as the higher prevalence for accident-related causes of death under age 30, are well established, but other associations are less commonly described. In this paper, we use predictive models to explore the relationships between policyholder characteristics and three major cause of death groupings.
Highlights:
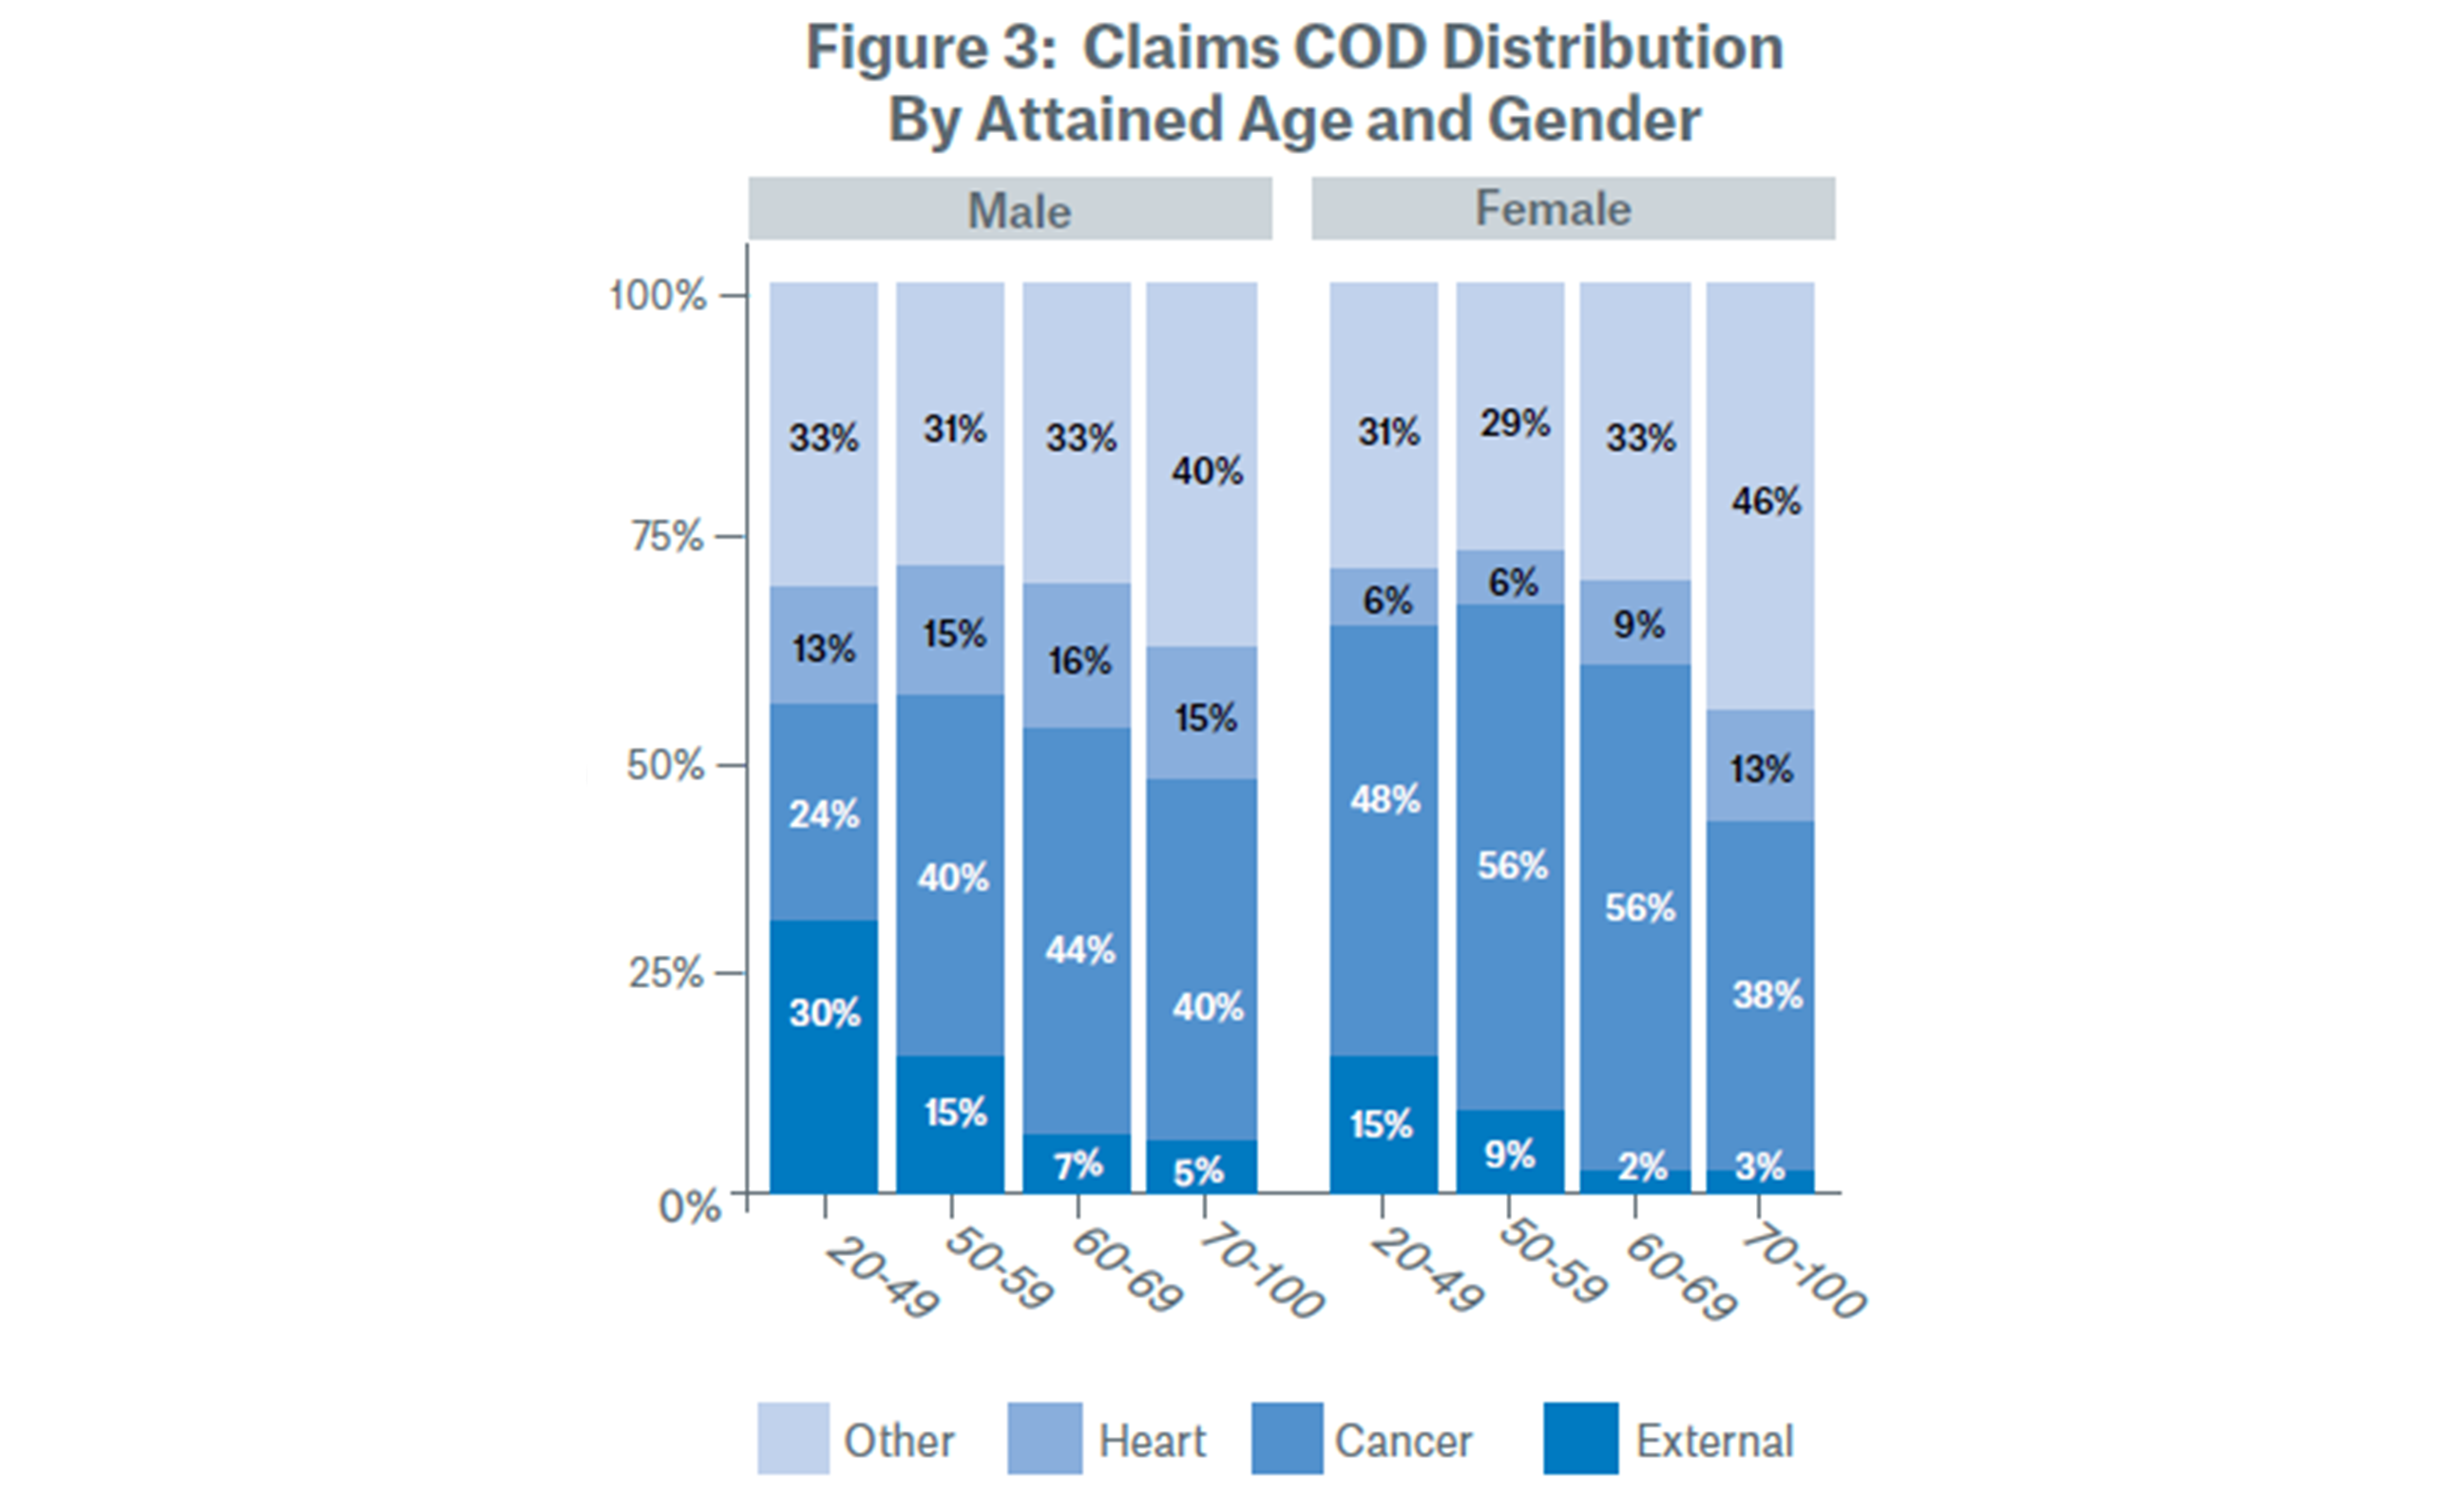
- In the insured population, cancer is the most common cause of death, but males have a larger share of heart and external related deaths compared to females.
- Gender differences are exhibited across attained age at death for all analyzed causes of death.
- Preferred class, face amount, and LexisNexis Risk Classifier® score are also predictive of cause of death, with clear distinctions for heart disease.
Background:
Using Munich Re’s U.S Individual Life portfolio of claims, we investigated attained age at death, duration, underwriting class (preferred non-smoker, standard non-smoker, smoker), product type (term or permanent), face amount, and LexisNexis Risk Classifier® (LNRC) score as possible explanations for differences in the relative proportions of cause of death (COD) codes for actual claims by gender. Our analyses focused on the two main physiological causes of death, cancer and heart disease, and external deaths due to accidents, suicides, assault. These three groups account for 66% of insured claims.
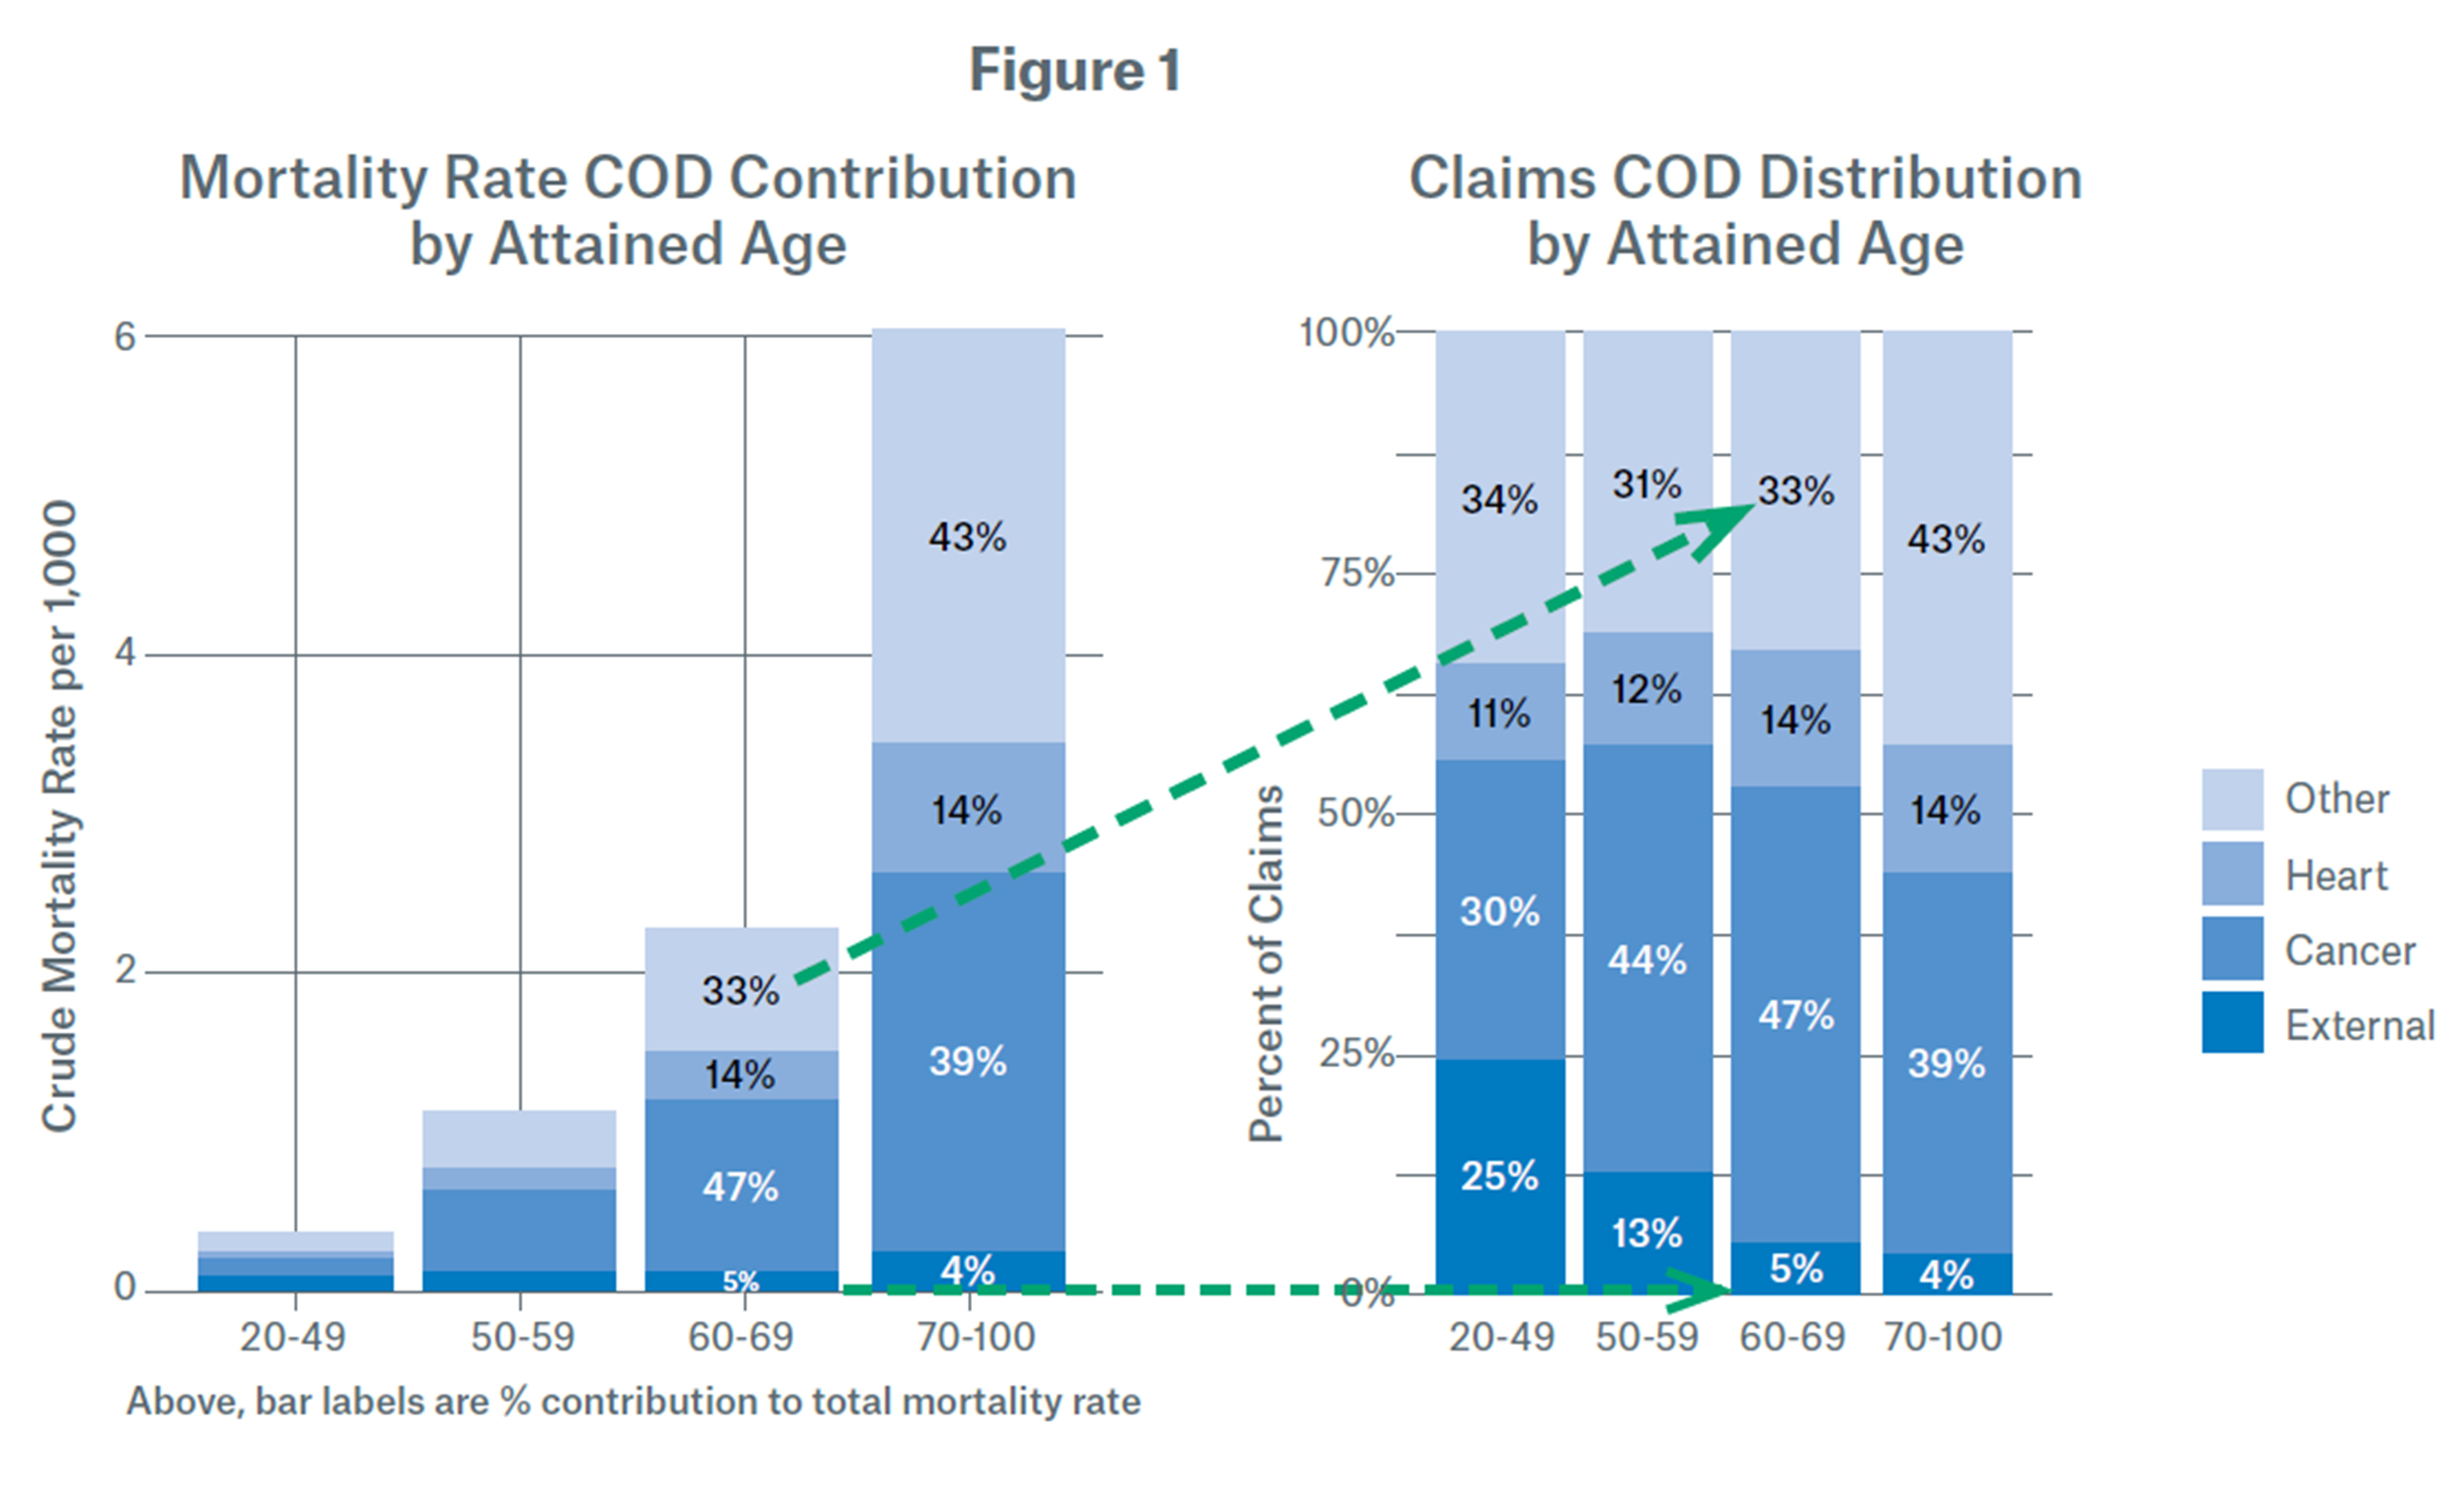
Given a claim, we examined the likelihood of each cause of death category using logistic regression. The likelihood may be expressed as a contribution to mortality rate or as a percent of claims. While the mortality rate contribution provides a reference for the total or crude mortality rate, we focus on the percent of claims for ease of interpretability. Figure 1 illustrates the equivalence of both metrics.
Our approach identifies significant relationships and isolates the impact attributable to each feature, while controlling for the presence of other predictors in the model. For any slice of the data, the total proportion of claims is split amongst cancer, heart, external, and all other. Thus, the differences observed for any single cause of death grouping are necessarily relative to the alternatives.
Data
· Calendar year 2007-2017 experience.
· Duration 3-10 only. Duration 1-2 claims were excluded to due to variations in contract provisions for early duration claims.
· Fully underwritten single life policies, new business issues (i.e. no conversions or exchanges), issue ages below 90, automatically ceded business, known smoking status, standard or better rate class.
· LexisNexis Risk Classifier® (LNRC) scores as of the date of underwriting; records without LNRC matches were excluded. LNRC is a non-medical mortality risk score based on public records, motor vehicle records, and credit attributes. Lower scores indicate higher mortality risk.1
· Cause of death groups were assigned based on ICD-10 code mapping used by the Society of Actuaries.2

Methodology
· Converting a multiclass classification problem into multiple, binary classification problems is referred to as “One vs All” or “One vs Rest”.
· A multinomial logistic regression, which models all causes of deaths simultaneously, was also fit and achieved similar performance in classification.
Heart Disease
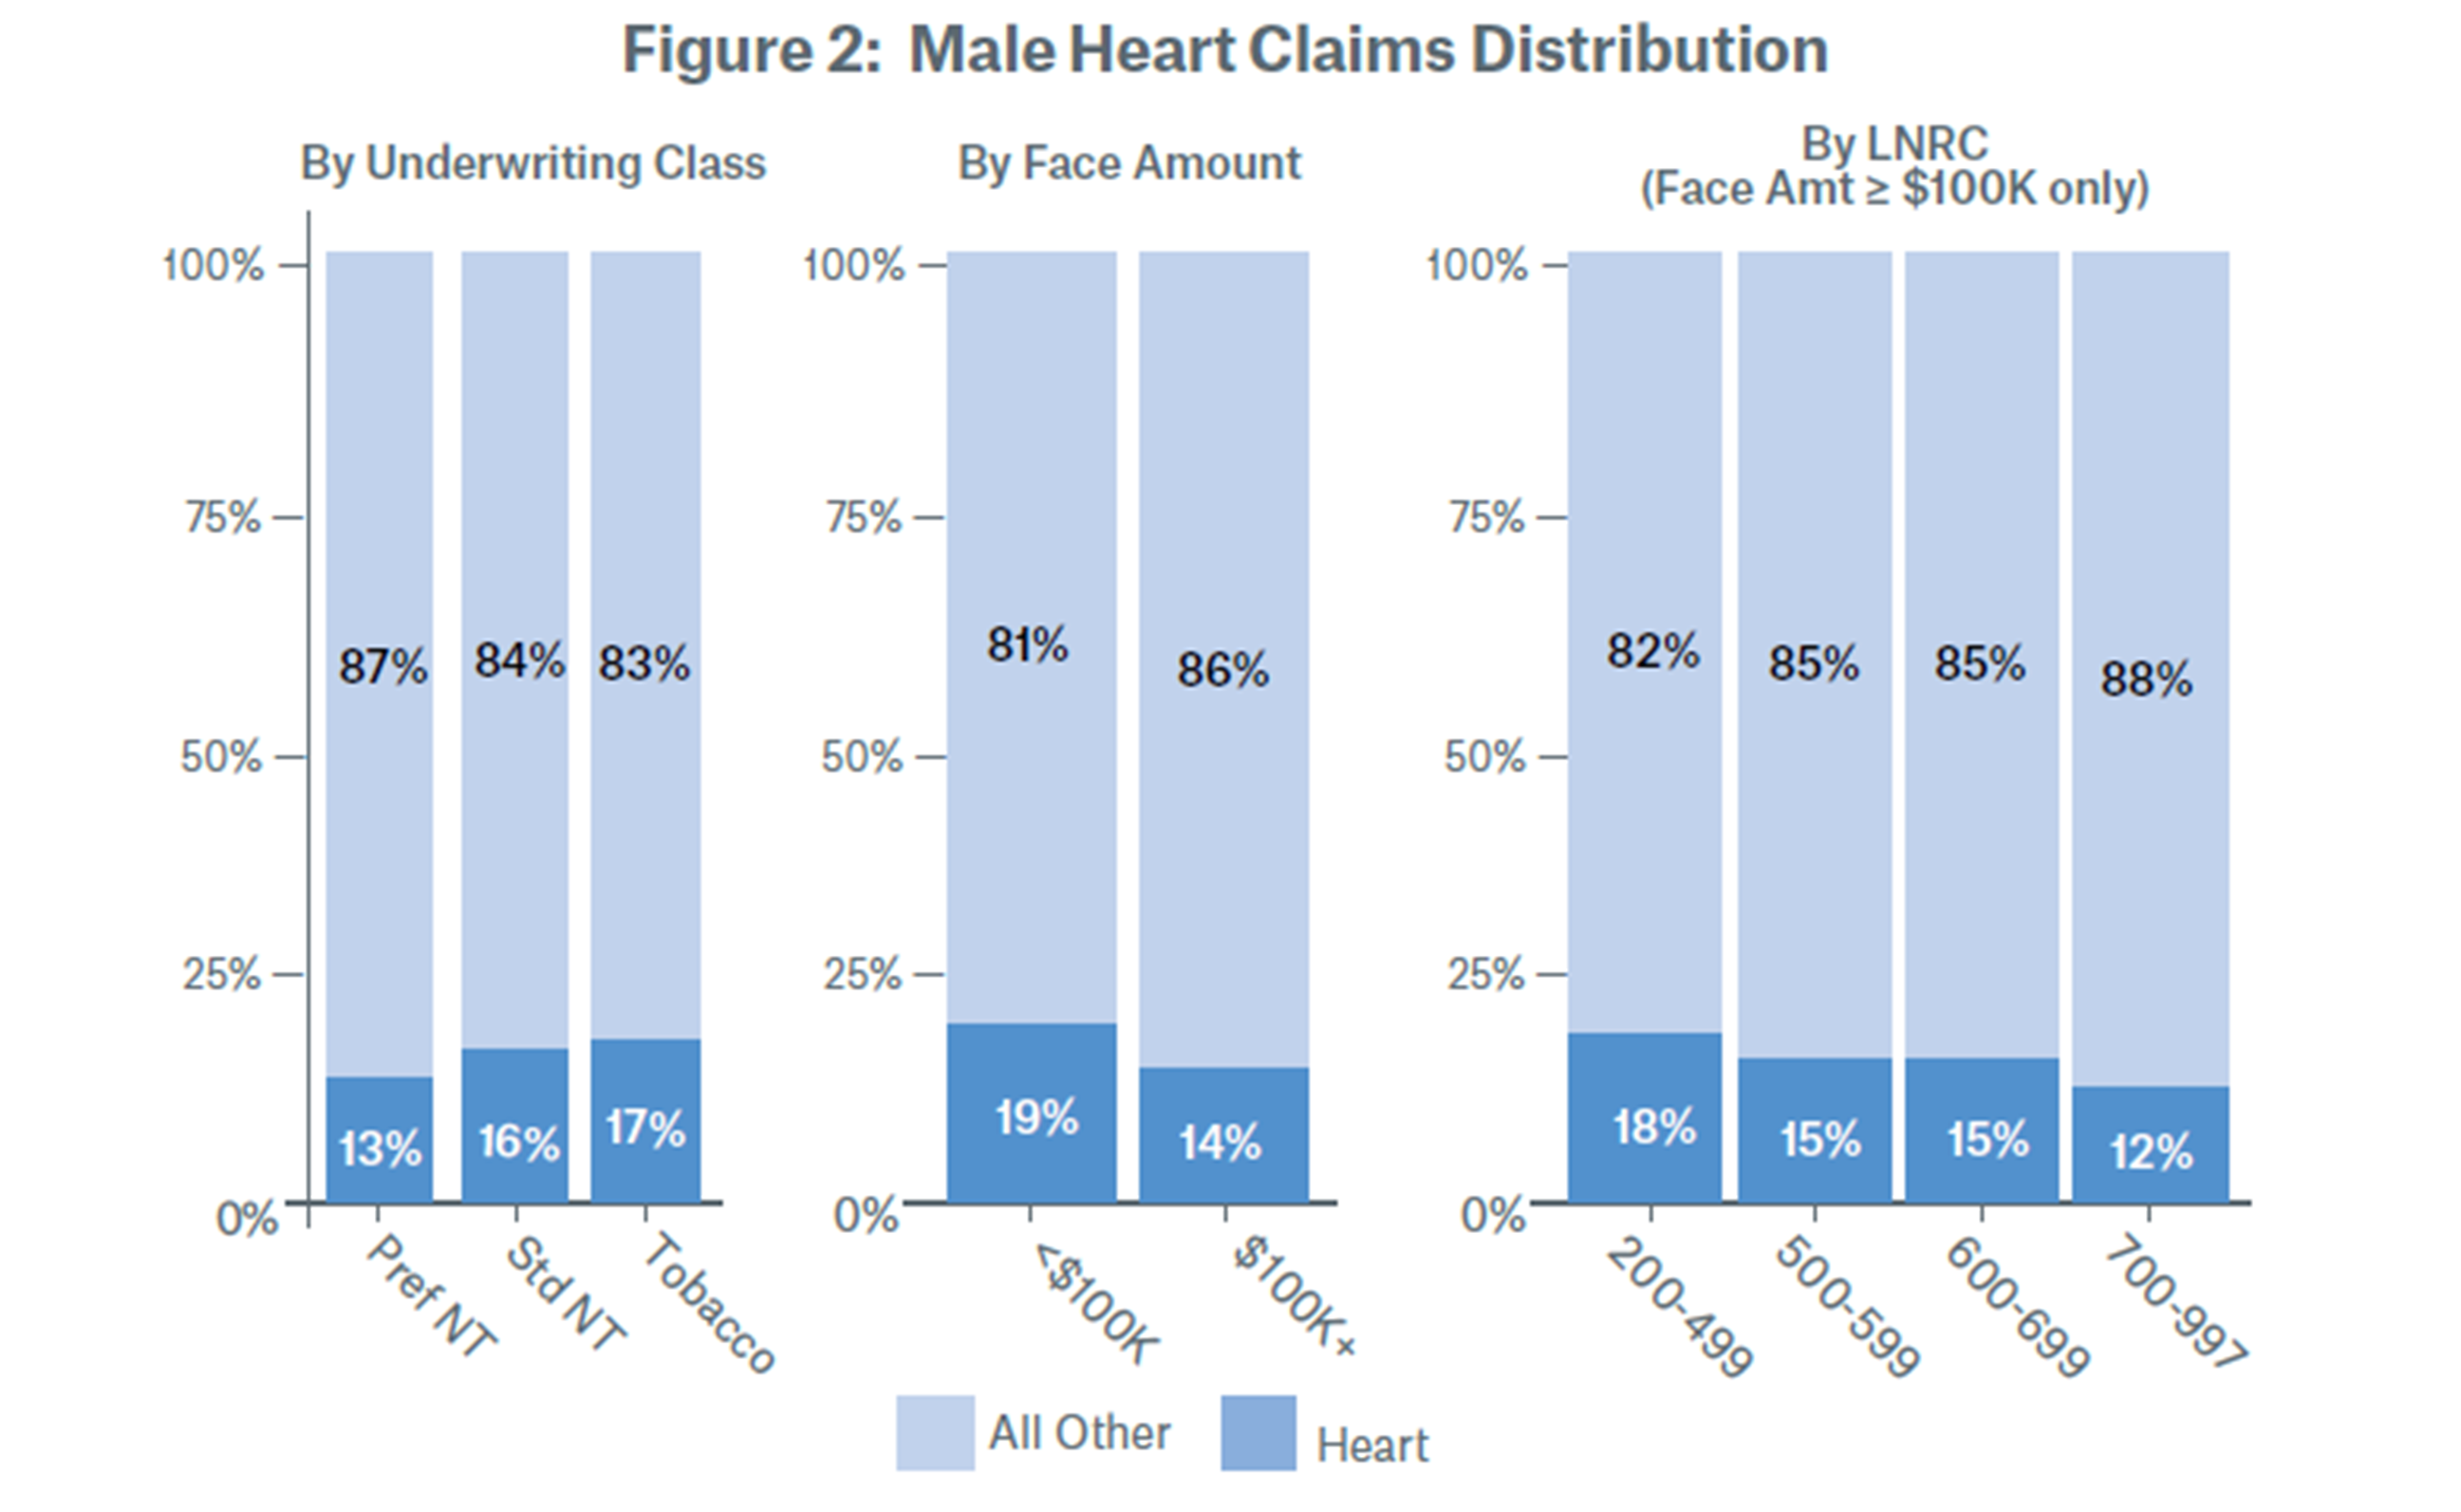
The efficacy of underwriting in detecting cardiovascular disease may be causing a skew in the insured population towards less heart disease and more cancer related deaths compared to the general population.3 We observe that standard non-smokers and smokers are more likely to have claims from heart disease (relative to any other cause of death) compared to preferred non-smokers. This pattern suggests that, within the insured population, preferred underwriting is effective at identifying those at lower of risk of heart disease.
Face amounts under $100K both males and females show a higher prevalence of heart disease deaths. This is most likely explained by less stringent underwriting requirements for face amounts under $100K. There is also a slightly higher prevalence of deaths due to heart disease at lower LNRC scores (that is, at the higher overall mortality risks), even after controlling for all other attributes.

Cancer
Smokers exhibit a higher probability of cancer deaths (relative to all other causes) for males after controlling for all other predictors, but for females the differences are negligible. The distribution of known cancer types by gender may explain this disparity. Across all ages of our study data, lung is the leading cancer type for males while breast cancer is the leading type for females. This is generally consistent with general population statistics which show that lung and bronchus is the leading cause of cancer deaths for males age 40 and above, while for females, breast cancer leads in ages 20-59, with lung overtaking breast cancer at age 60 and above.4
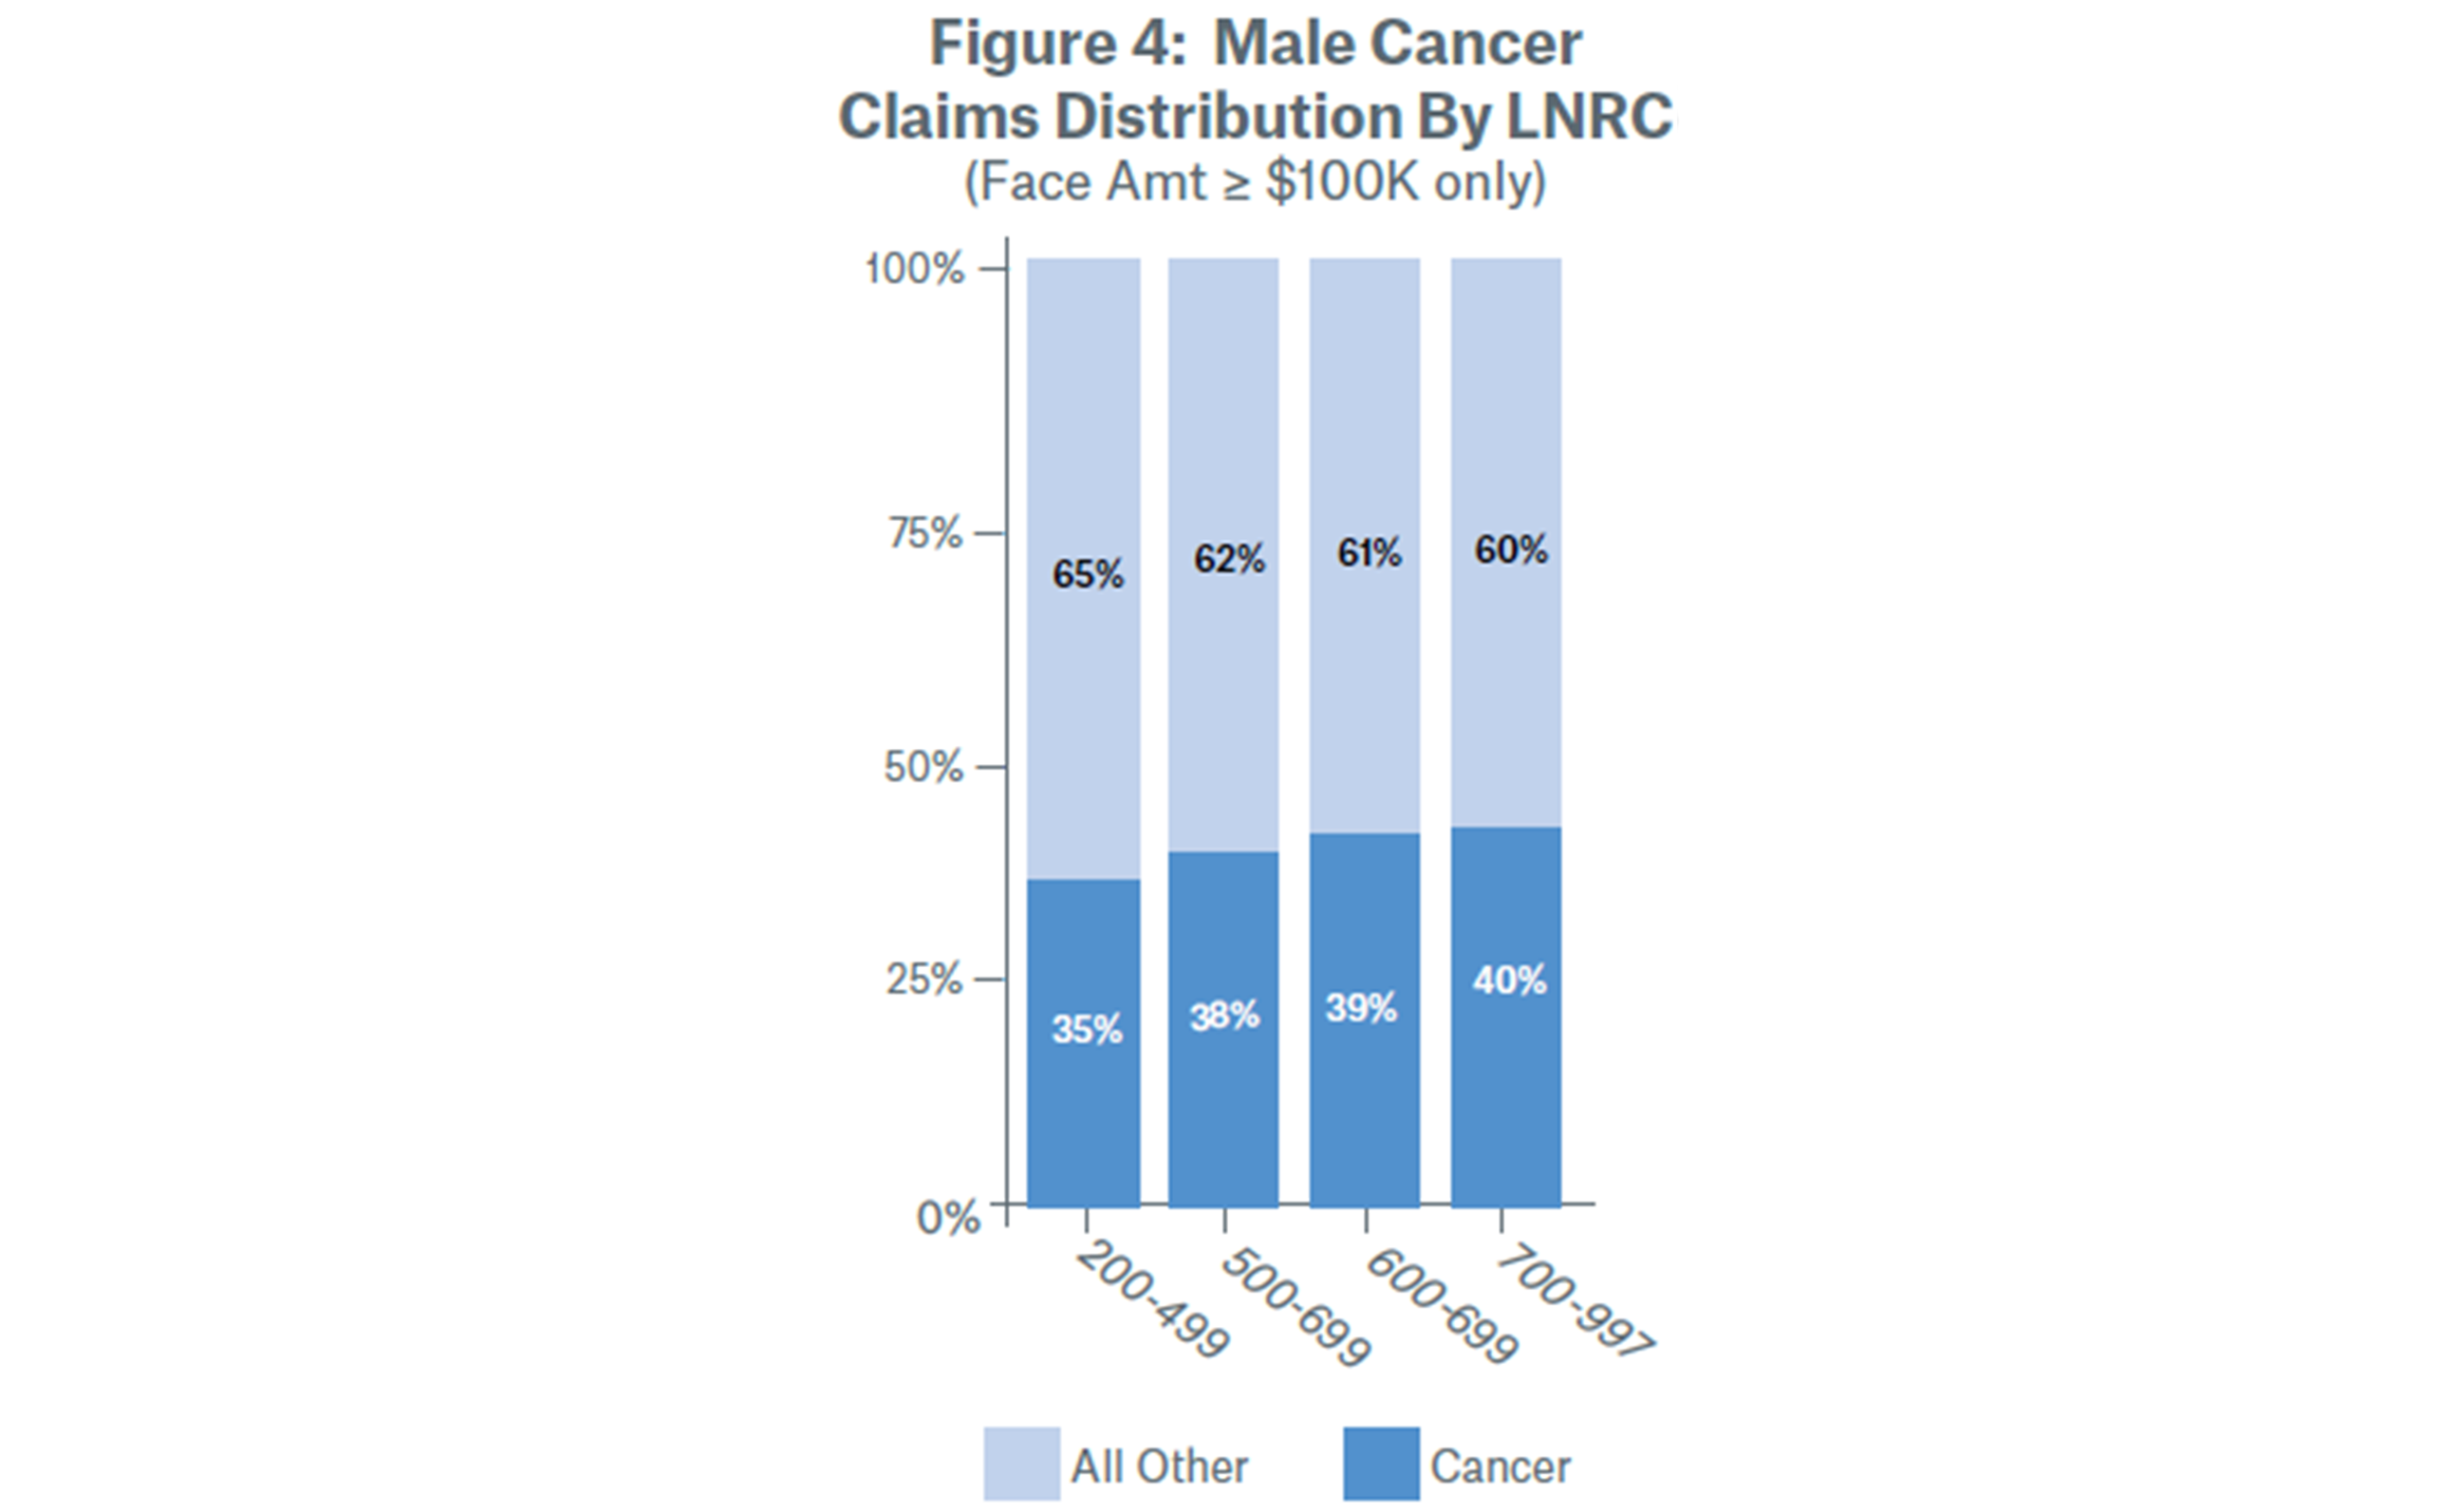
In a related manner, it is not surprising that the proportion of cancer claims varies significantly by attained age and gender. Males exhibit a lower cancer proportion of total claims, offset by higher levels of heart and external causes of deaths compared to females. The probability of cancer for males relative to all other causes of death generally increases with attained age up to age 70, followed by a slight decline at the oldest attained ages. The pattern for females is similar but exhibits a more pronounced decline at the oldest ages, as heart claims tick up more for older females. Overall, we see a slightly lower likelihood of cancer claims relative to all other at the lowest LNRC scores (that is, at the higher overall mortality risks) for both males and females, at least partially reflecting that heart disease had higher prevalence among lower LNRC scores.


Cancer is a complicated risk and overall, advancing age is the most important risk factor for cancer.5 While many cancer-causing mutations are related to environmental factors or inherited mutations, random DNA-copying mistakes can also create these errors, though scientists do not yet agree on whether intrinsic or extrinsic causes of mutations are more significant.6 Still, the “bad luck” of a healthy dividing cell making a random mistake suggests that individuals who are considered better mortality risks are still susceptible to cancer as a cause of death, all else equal.
External Deaths
For external causes of death (accidents, suicides, and assault), claim counts are more sparse compared cancer and heart claims, meaning that there is slightly more variability associated with the results. The likelihood of an external cause of death relative to all other causes is highest for face amounts above $500K. Larger face amounts being associated with external causes of death is similar to the standalone pattern previously observed for suicides in the insured population.7 As seen for cancer, LNRC scores are predictive after controlling for face amount (as well as age, duration, product, class, and gender). Mortality rates are lower at higher face amounts and at higher LNRC scores, suggesting that external causes of death are more likely relative to other causes of death for cohorts with lower mortality risk.
Conclusion
Although the attributes available in this dataset do not describe all of the variability in causes of death for any given claim, patterns in cause of death prevalence are apparent. Using a predictive modelling approach allows us to affirm these patterns even in the presence of correlation amongst the available features. These selected observations provide insight around cause of death claim distributions in the insured population and how they vary by attributes such as attained age, gender, underwriting class, face amount, and LNRC scores. We hope this will generate discussion and lead to more informed projections of future mortality risk and mortality improvement.
Considerations
· While our analysis is consistent with the percent contribution to the total mortality rate by cause of death, it does not model the actual mortality rate by cause of death.· For some areas of the data, a greater sample size would likely reveal more robust trends, mainly for females and external causes of death. · A large proportion of claims fall into “Other causes of death” and are not discussed independently as there are fewer unifying traits for this group. · Due to limited claim counts in some regions of the data, only main effects were modelled, so the true associations may be more subtle if interactions are considered.
Downloads
Contact the Authors
/Julia%20Druce.jpg/_jcr_content/renditions/original./Julia%20Druce.jpg)

Related Solutions
Newsletter
properties.trackTitle
properties.trackSubtitle

