
This paper is the first in our series examining the potential of third-party data sources to enhance life insurance underwriting.
Background and objective
The life insurance industry has long recognized the potential of wearable physical activity data to enhance underwriting processes. Industry studies have demonstrated the value of incorporating this data into risk assessments and recent accelerated underwriting (AUW) surveys indicate that carriers are assessing, but not yet ready to adopt, wearable data in underwriting.1,2,3 As technology continues to advance, the concept of leveraging wearable data—such as daily step counts and moderate to vigorous activity levels—to enhance the underwriting process is becoming increasingly compelling.2
To further explore this opportunity, Munich Re Life US collaborated with Klarity, a UK-based health data analytics firm, to conduct a comprehensive study using biometric data from the UK Biobank.4 Our overview paper addressed key considerations for utilizing UK Biobank data in life insurance, this analysis delves into the mortality impact of physical activity data. Our research aims to:
- Validate the effectiveness of wearable physical activity data, particularly step count, in refining mortality risk segmentation.
- Illustrate how daily step count can help insurers identify low-risk applicants who may have been overlooked by traditional underwriting methods.
- Highlight the benefits of light-intensity physical activity in improving mortality risk, especially among older age groups who struggle to meet recommended guidelines for moderate to vigorous activity.
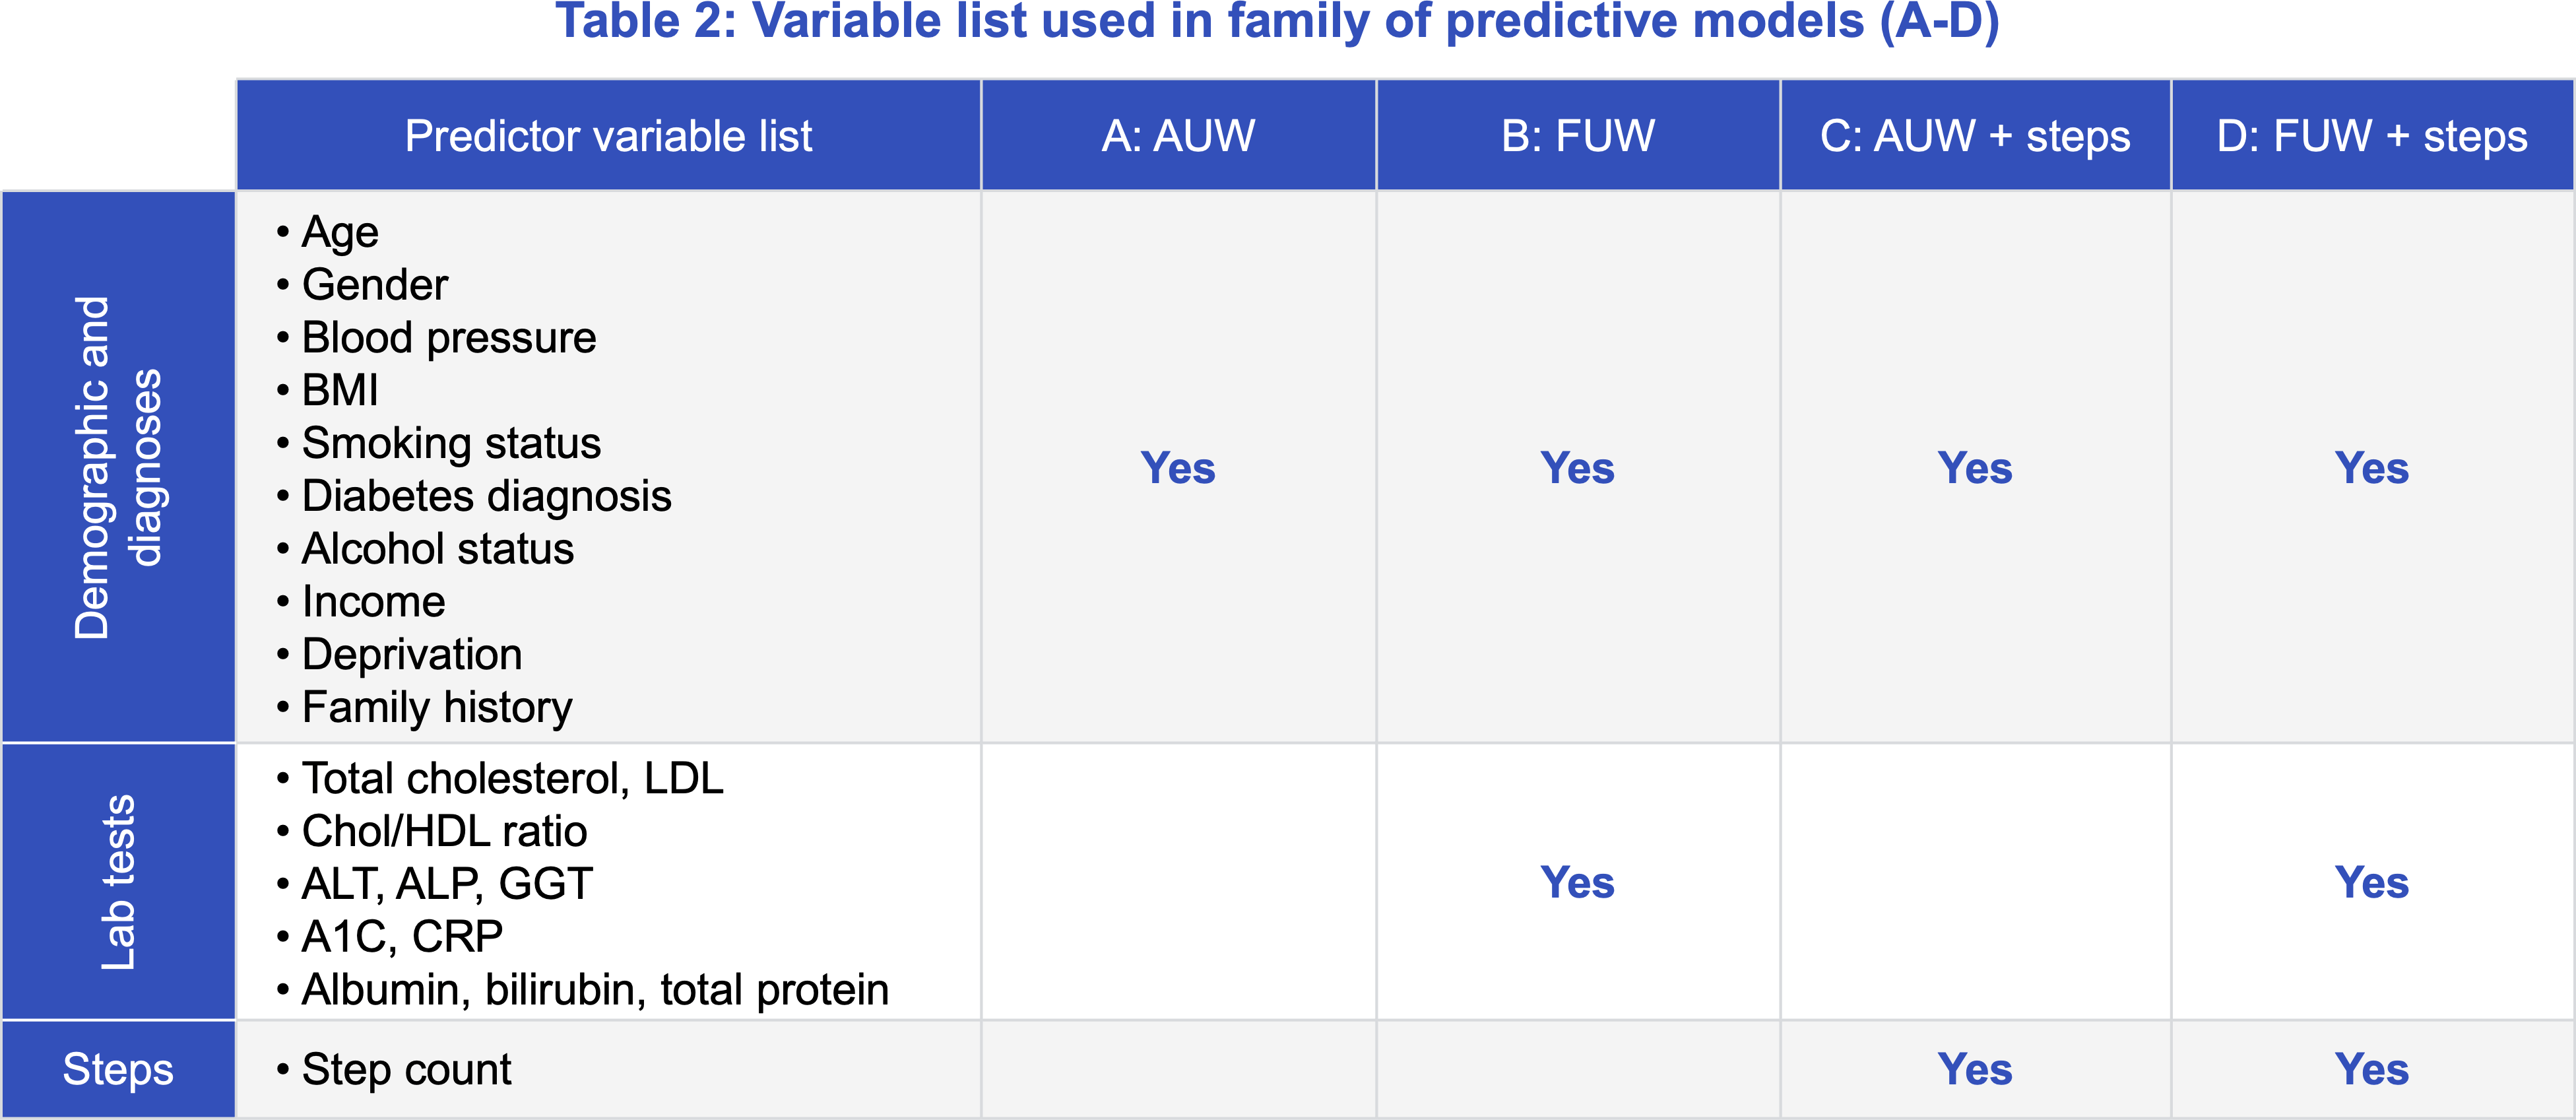
- Compare the predictive power of traditional underwriting evidence versus step count-based models for mortality risk segmentation using output from Klarity's proprietary predictive models.
Overall results
The results of this study corroborate the conclusions from a previous Munich Re white paper regarding the use of step data in stratifying mortality.1
- Daily step count effectively segments mortality across age, smoking status, BMI, and gender, and in a comprehensive model, step count is more predictive of mortality compared to several traditional measures, including BMI, and second only to age.
- Comparing two separate predictive models developed by Klarity on risk segmentation revealed that the step count-based model outperformed the traditional underwriting evidence-based model.
- Our research also uncovered additional variables, such as light-intensity activity time, that are also effective in segmenting mortality risk for those who do not participate in activities measured by step count.
The analysis is based on the “insurable” dataset records with measured physical activity data obtained from wrist accelerometer readings, approximately 22% of the “insurable” pool. The final physical activity dataset included 58,631 lives including 837 deaths. (Additional details on the UK Biobank and the datasets used in this study can be found in our introduction to this series.)
Daily step count
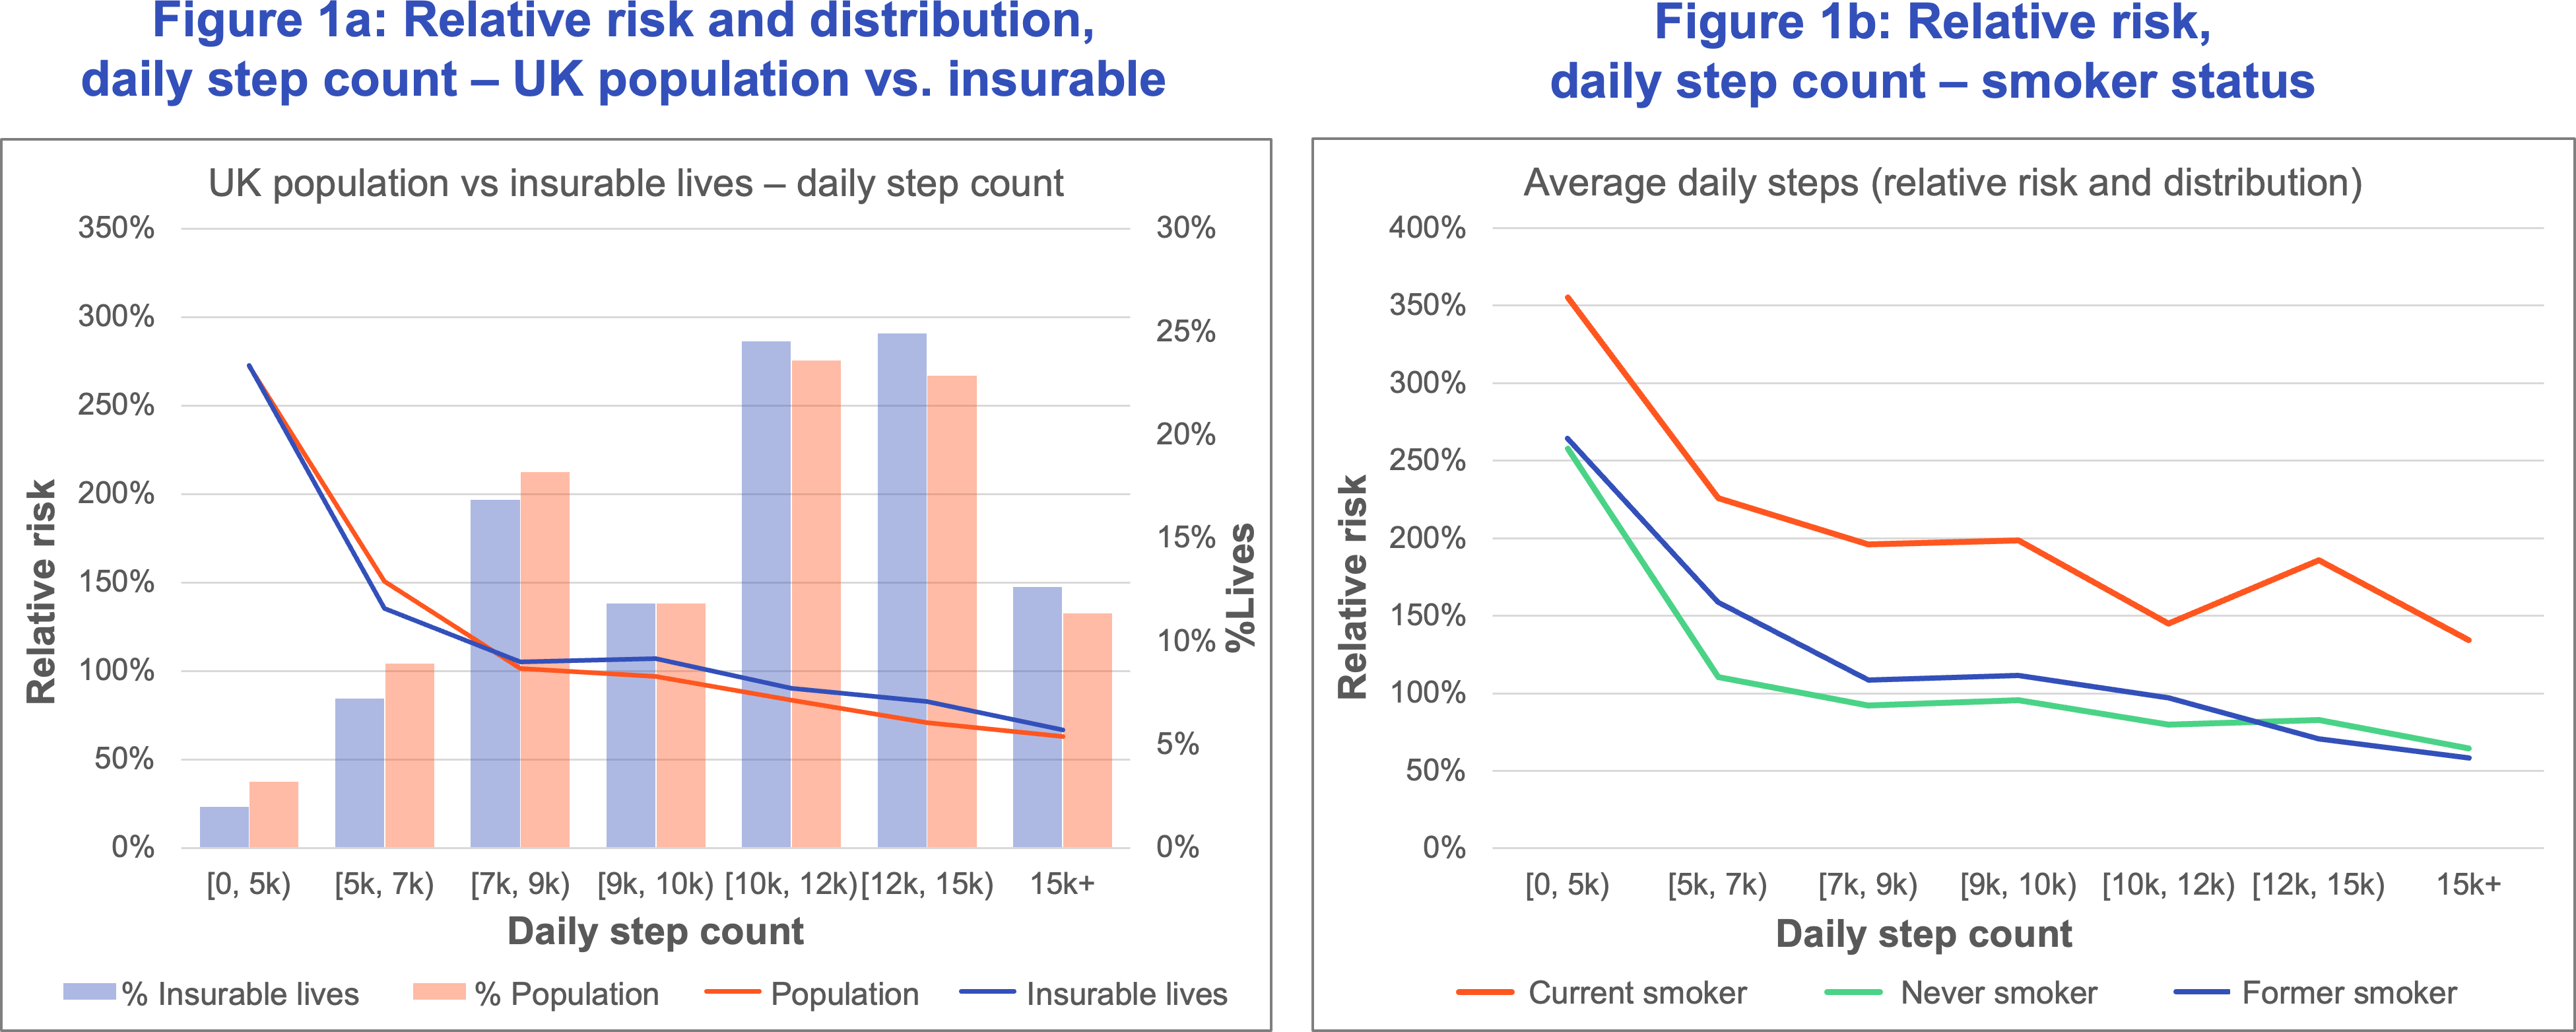
Steps per day have a material impact on mortality with increased step count associated with lower mortality. Figure 1a displays the relative risk and distribution of lives for the subsets of the “population” and “insurable” datasets with daily step count measurements. Both the “population” and “insurable” data sets show a similar pattern of decreasing risk with an increase in daily step count (Figure 1a). Mortality risk in the 0 to 5,000 step count range was more than four times that in the 15,000 and above range.
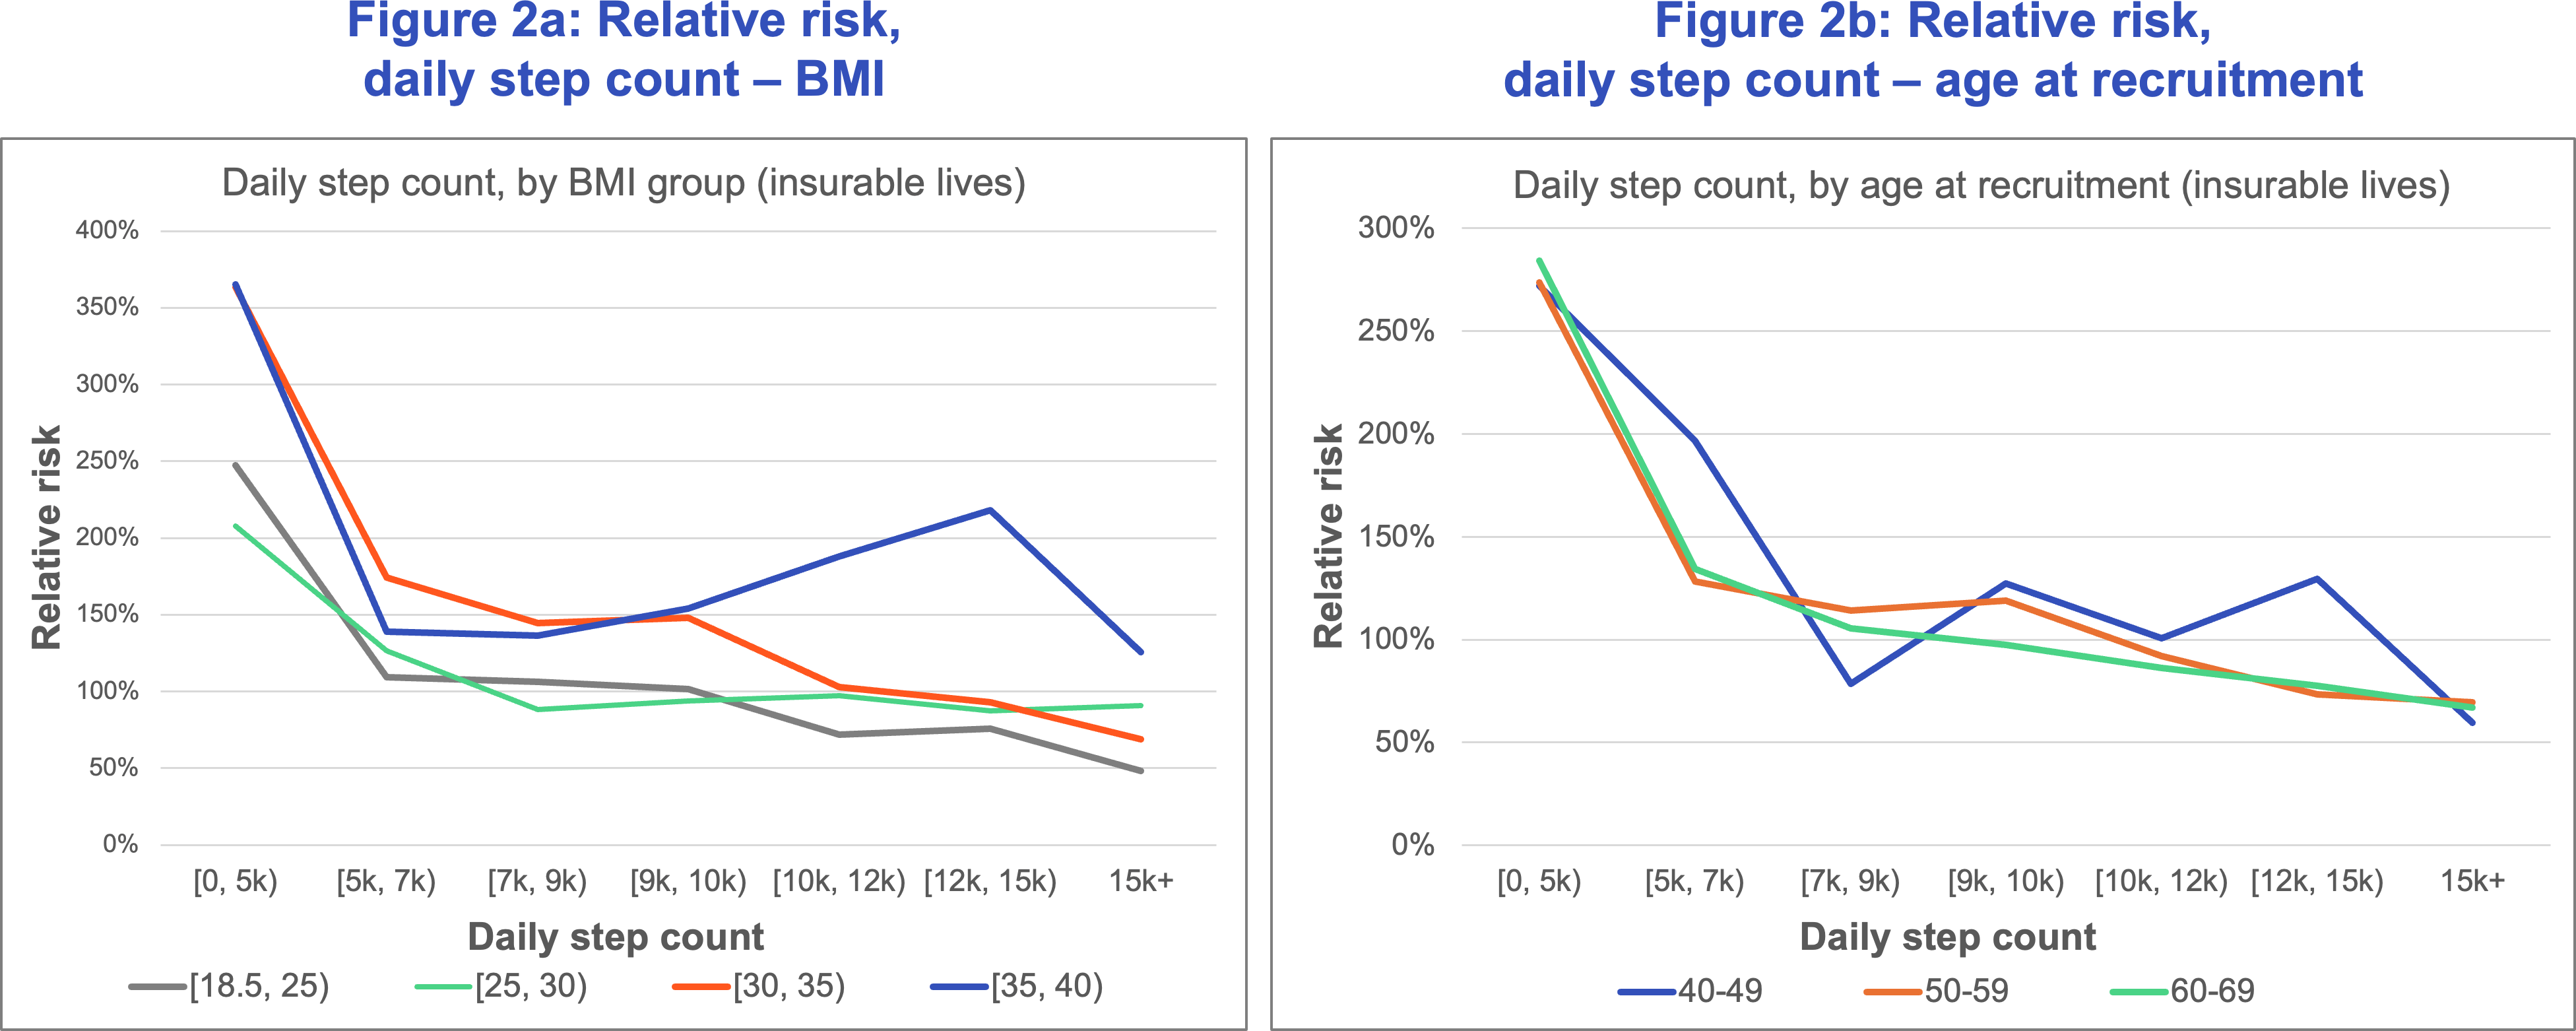
The greatest benefit accrues for individuals increasing their daily step count from below 5,000 to around 7,000, after which the incremental benefit accrues at a slower rate. Mortality patterns similar to Figure 1a are also observed when results are viewed by age, gender, and BMI (excluding BMI below 18.5).
Figure 1b shows that “current” smokers with a daily step count of at least 7,000 have better mortality than “never” and “former” smokers with fewer than 5,000 daily steps.
Expanding insurability
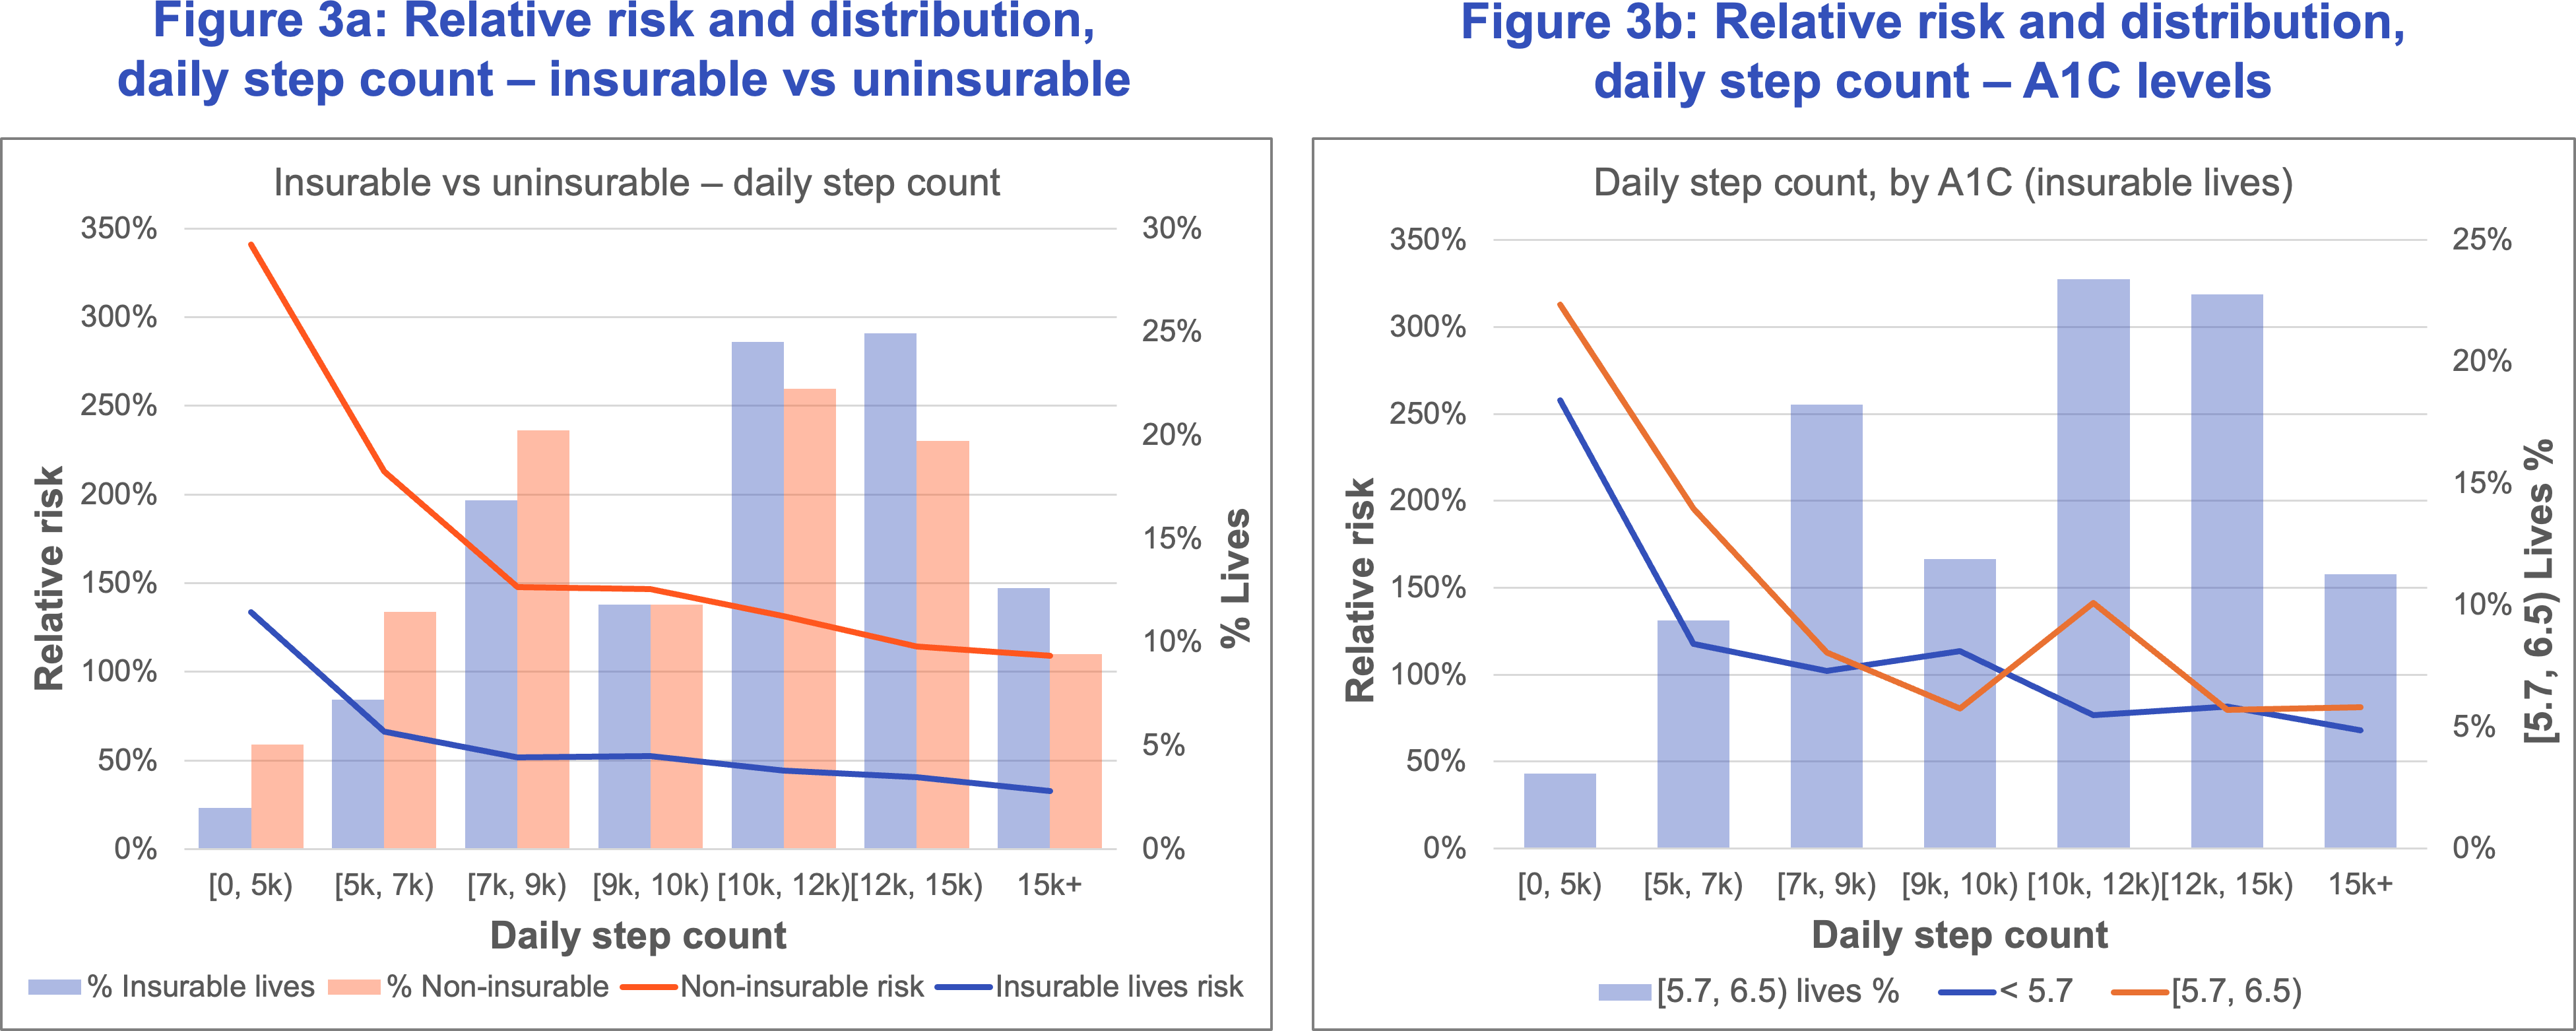
Figure 3a splits the physical activity dataset into the “insurable” and “uninsurable” pools. Mortality risk for those in the “uninsurable” pool with at least 10,000 daily steps is slightly lower than that for the below 5,000 step “insurable” group. Targeting a segment of physically active individuals on the fringe of acceptable underwriting requirements who are currently not considered for insurance may help carriers meet their goals of expanding insurability without adversely impacting mortality risk.
Figure 3b demonstrates the value of step count in segmenting the mortality risk for pre-diabetics with A1C between 5.7 and 6.5. Here the relative risk for pre-diabetics with at least 7,000 daily steps is 60% lower than it is for normal A1C (below 5.7) individuals with fewer than 5,000 steps.
Minutes of moderate, vigorous, and light activity

Predicting mortality using daily step count


Traditional underwriting versus daily step count – risk class segmentation
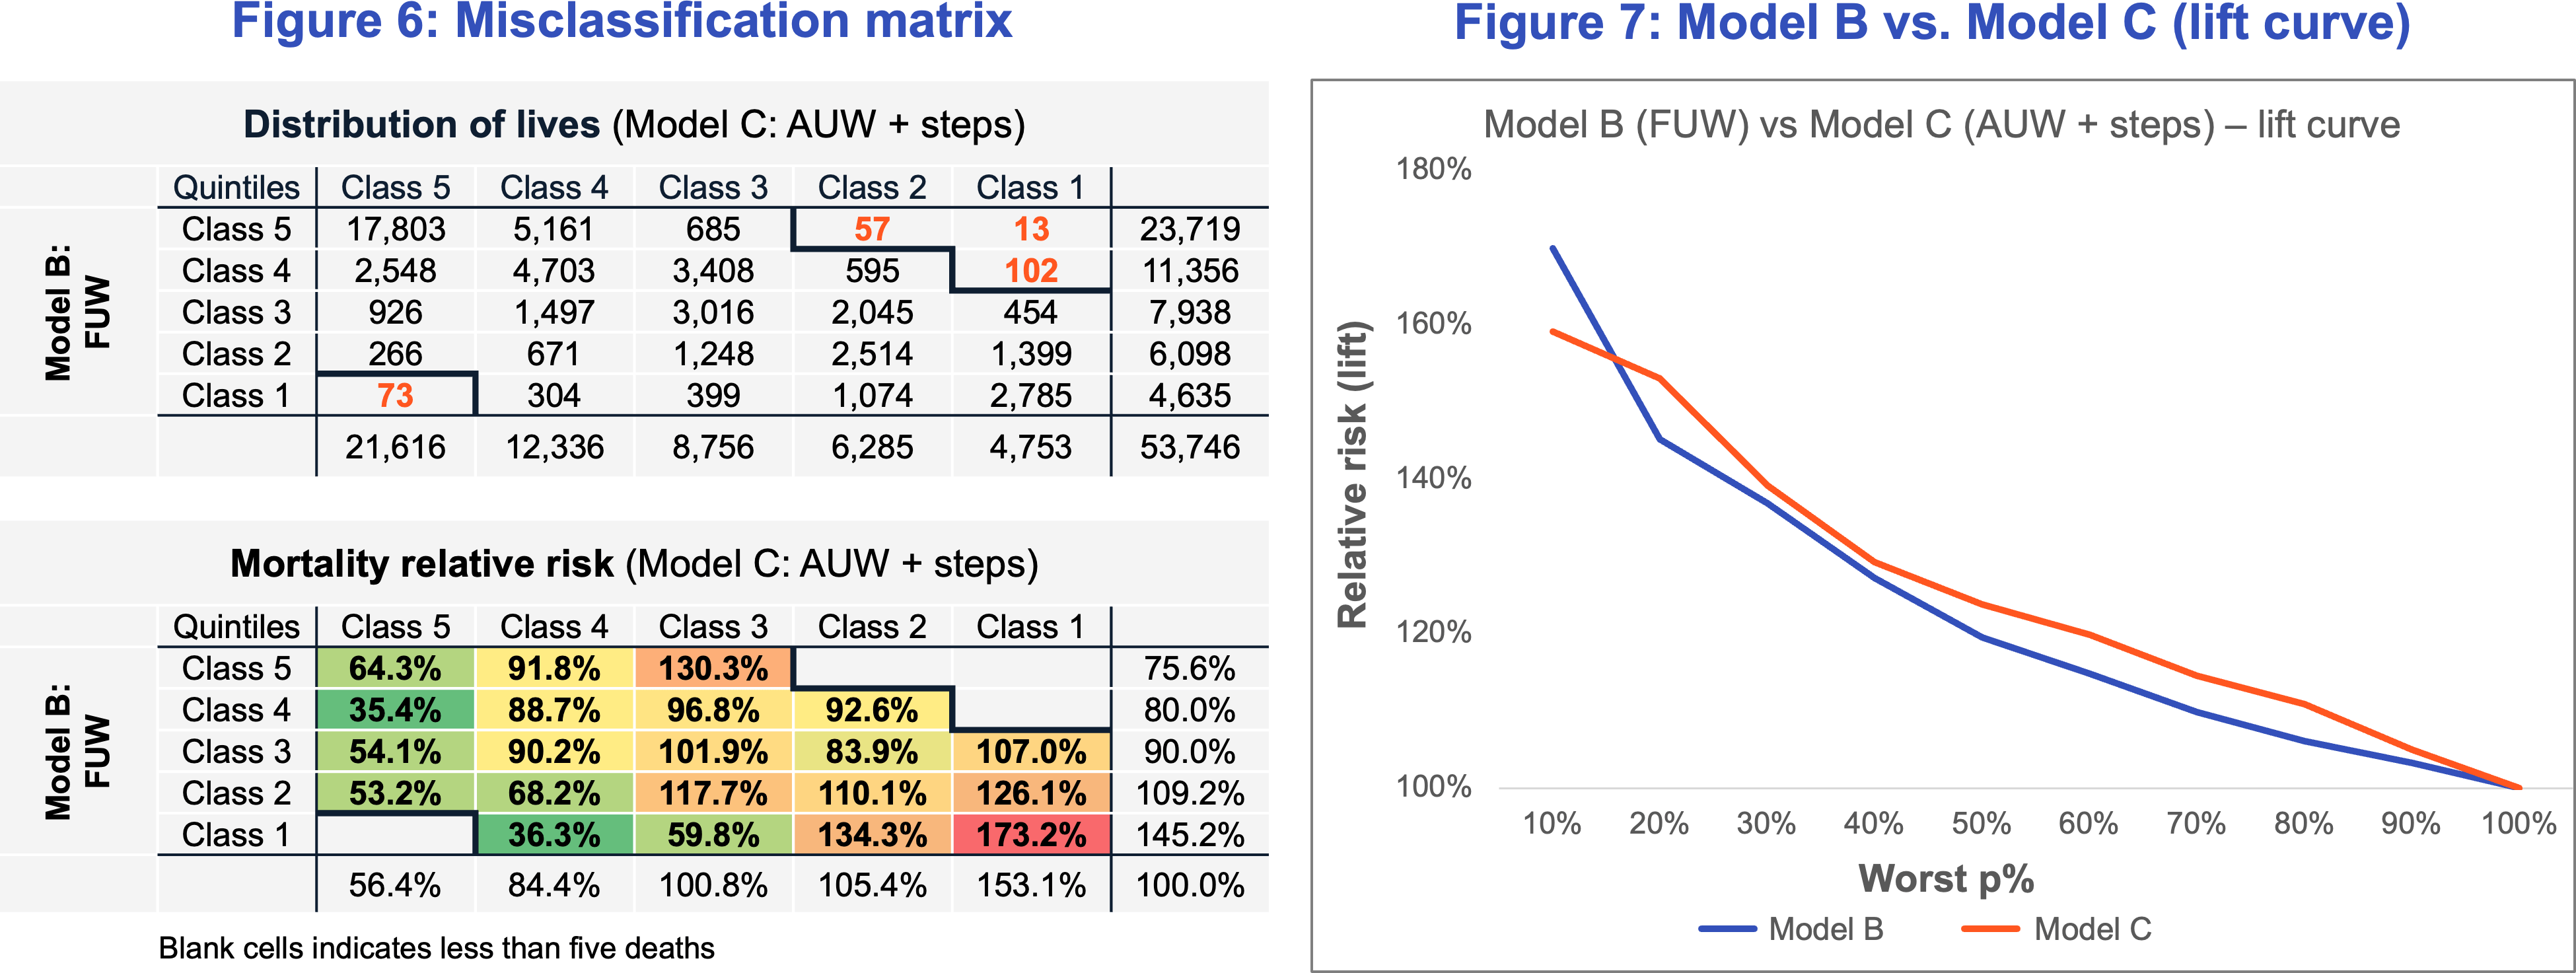
Relative mortality risk for Model C’s best quintile (Class 5) was 56.4% versus 75.6% for Model B (Figure 6). Similarly, the risk for the worst quintile (Class 1) was 153.1% for Model C compared to 145.2% for Model B. This suggests that Model C produced a more differentiated risk pattern compared to Model B across Class 5 to Class 1, indicating better mortality segmentation when adding step data to an AUW model versus FUW only. The distribution along the diagonal indicates that the models had a 57% quintile match rate.
We also observed that when the results are split more granularly by risk deciles (Figure 7), Model C offered a greater “lift” compared to Model B across the range of risk, except for the worst risk decile. This demonstrates that Model C is more useful in risk differentiation at the “preferred” end of the risk spectrum and Model B would be more useful in identifying the most impaired or substandard risks. The lift curve can also be used to make informed decisions in the context of setting up an AUW program where step count thresholds may be used as a front-end underwriting triage tool to arrive at a specific straight-through processing (STP) rate.
While the results above demonstrate better risk segmentation for the steps Model C relative to the fluids Model B, the following caveats should be noted:
- Initial screening criteria used to select the “insurable” pool from the population, eliminated highly impaired or “declinable” risks. In practice, carrier pools may not have stringent screening criteria. Also, industry misclassification matrices show that even a handful of “declined” or impaired large face amount cases can have a disproportionate adverse impact on results.
- The UK Biobank participants did not have a motive to misrepresent about their health and lifestyle. Life insurance applicant pools generally include some individuals who are less than truthful about their health.
- In this example, the cases with “reverse” misclassification, where the steps model generates a more conservative assessment than the fluids model, outnumber the cases where the fluids model generates a more conservative risk class. This is not a typical finding for AUW programs.
- Munich Re Life US has evaluated the performance of Klarity's models based on model output. Munich Re Life US has not had access to any of the underlying machine learning models.
Way forward for wearables physical activity data
This study performed by Munich Re Life US and Klarity demonstrates the significant benefit of using wearable physical activity data to segment risk and potentially expand insurability.
Although the study data was UK population-based, the selection criteria applied to simulate an insurable population, along with key findings on the mortality impact of daily step count and activity minutes, provide a strong case for exploring AUW programs that incorporate wearable physical activity.
Further considerations for using wearable physical activity data include:
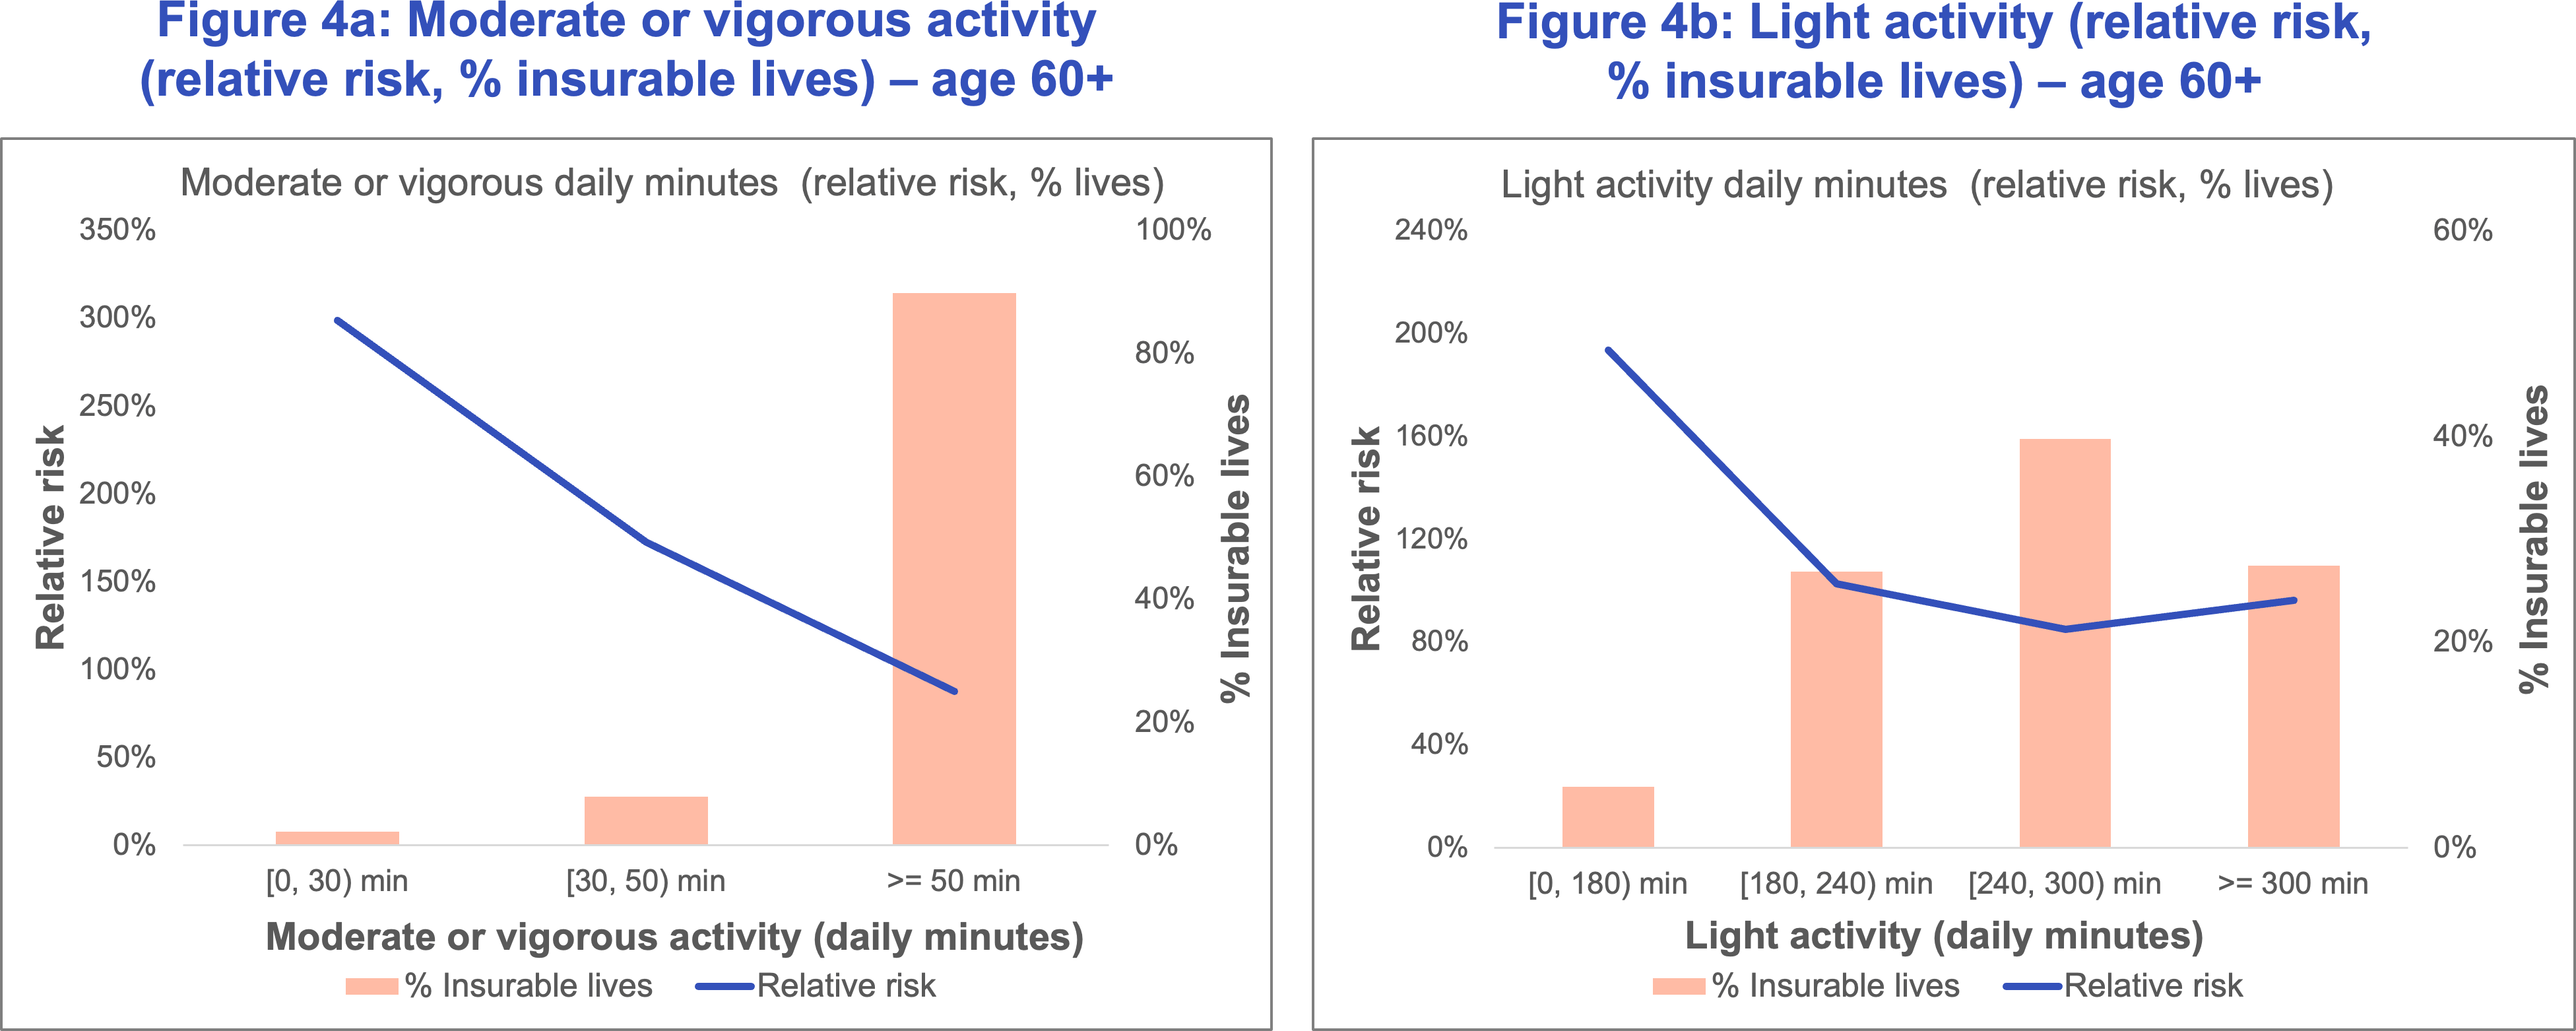
- Even participating in light-intensity physical activity confers significant mortality benefit. This is particularly relevant for older or impaired individuals, who may not be able to comply with widely publicized recommendations of step count or moderate or vigorous activity but can yet improve their health by making modest increments to their light activity levels.
- There is a strong case for using physical activity data from wearable devices in life insurance underwriting, particularly in a fluidless (AUW) environment with guardrails in place. Step count can also be used as a front-end underwriting triage tool.
- Having the appropriate guardrails to prevent anti-selection is critical for AUW program viability. Judicious use of verified data sources such as third-party lab results, medical claims history, and electronic health records (EHRs) that can weed out declinable or heavily substandard risks can complement the use of step count in an effective AUW program. Precautions to ensure that applicant physical activity data is not a result of a short-term behavior change but indicative of a sustained habit should be taken to prevent misrepresentation.
- It is important for carriers to have the technology infrastructure in place to accommodate data from various wearable devices to address the challenges of data non-uniformity. Efforts should also be made to prevent potential biases against individuals who, due to various circumstances, cannot dedicate time to physical activity. Another consideration is that the photoplethysmography (PPG) technology underlying the popular smartwatches can be less accurate for individuals with darker skin tones or those with obesity. Data security and customer data privacy concerns should also be addressed.
Carriers looking to incorporate wearables information into their underwriting process can first conduct a pilot to assess participation rates and estimate their baseline physical activity patterns. This can be followed by a more comprehensive customer risk assessment. Munich Re Life US is committed to helping carriers navigate the process of program development and monitoring, providing tailored support and guidance.
The next paper in the series will examine the mortality impact of average heart rate and sleep duration.
References
Contact


Related content
Newsletter
properties.trackTitle
properties.trackSubtitle

