
This paper is the third in our series examining the potential of third-party data sources to enhance life insurance underwriting.
Background
This publication is the final in a series of analyses of the UK Biobank data, conducted between Klarity, a UK-based health data analytics firm, and Munich Re Life US.1 This study considers alternative attributes to body mass index (BMI) for assessing mortality risk: waist circumference, waist-to-height ratio, and waist-to-hip ratio. Although BMI is an attribute that has been used in life insurance underwriting since the early 20th century to assess obesity and its mortality impact, BMI alone may be an imprecise indicator for metabolic health.2 BMI does not consider the distribution of fat tissue or differences in body type. While BMI is predictive of mortality, we consider other physical measurements that can be layered onto BMI to help refine risk assessment. In particular, waist circumference, waist-to-height ratio, and waist-to-hip ratio can better capture different distributions of body fat than BMI.
Objective
This study examines the UK Biobank data to accomplish the following:
- Analyze the effectiveness of alternative build-related attributes in stratifying mortality risk of a simulated insurance population.
- Consider how these alternative build-related attributes, such as waist-to-height ratio, can be used in addition to the traditional life insurance BMI factor to refine risk assessment.
Data and extrapolation to life insurance
Similar to the earlier publications in this series, the analysis in this study focuses on the UK Biobank data that Klarity extracted. Variables relevant to the study include:
Demographic information: age, gender, income, index of multiple deprivation (IMD, a UK measurement of poverty and access to services within a small geographic area)
Physical measurements/vitals: weight, height, waist circumference, BMI, blood pressure, hip circumference
Note that the waist and hip measurements were recorded in a well-controlled setting that may not be easily replicable in a life insurance underwriting setting. Also, the Biobank study participants were not underwritten for life insurance, so any anti-selection associated with applying for life insurance is not relevant in this setting.
Like the previous studies, the analysis and results discussed onwards are based on the filtered “insurable” block of individuals, unless stated otherwise.
Classic actuarial methodology
Results

BMI
Waist-to-height ratio
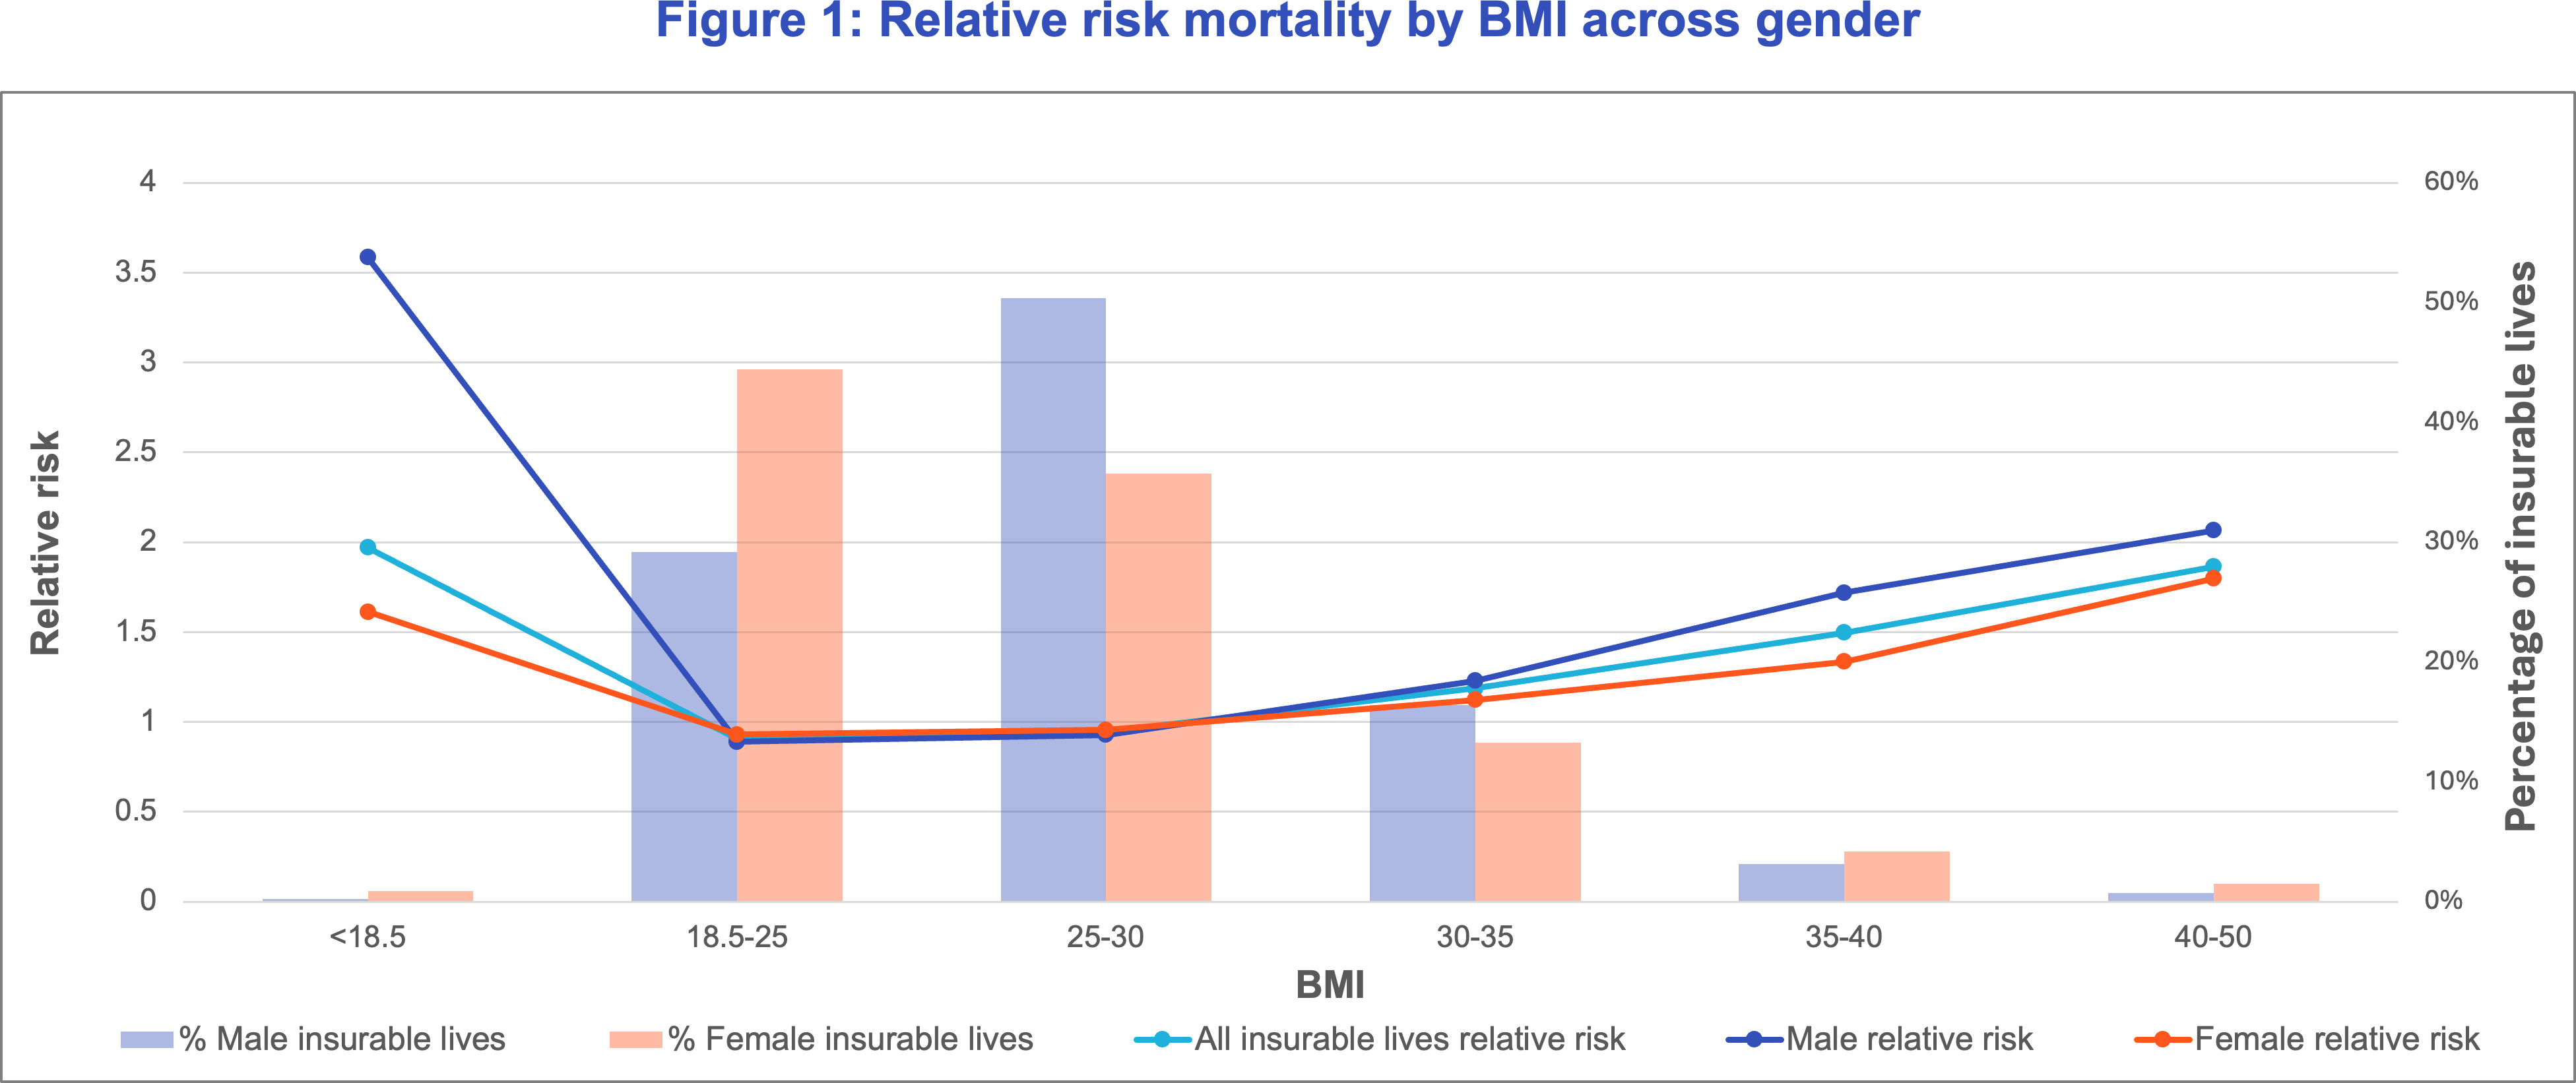
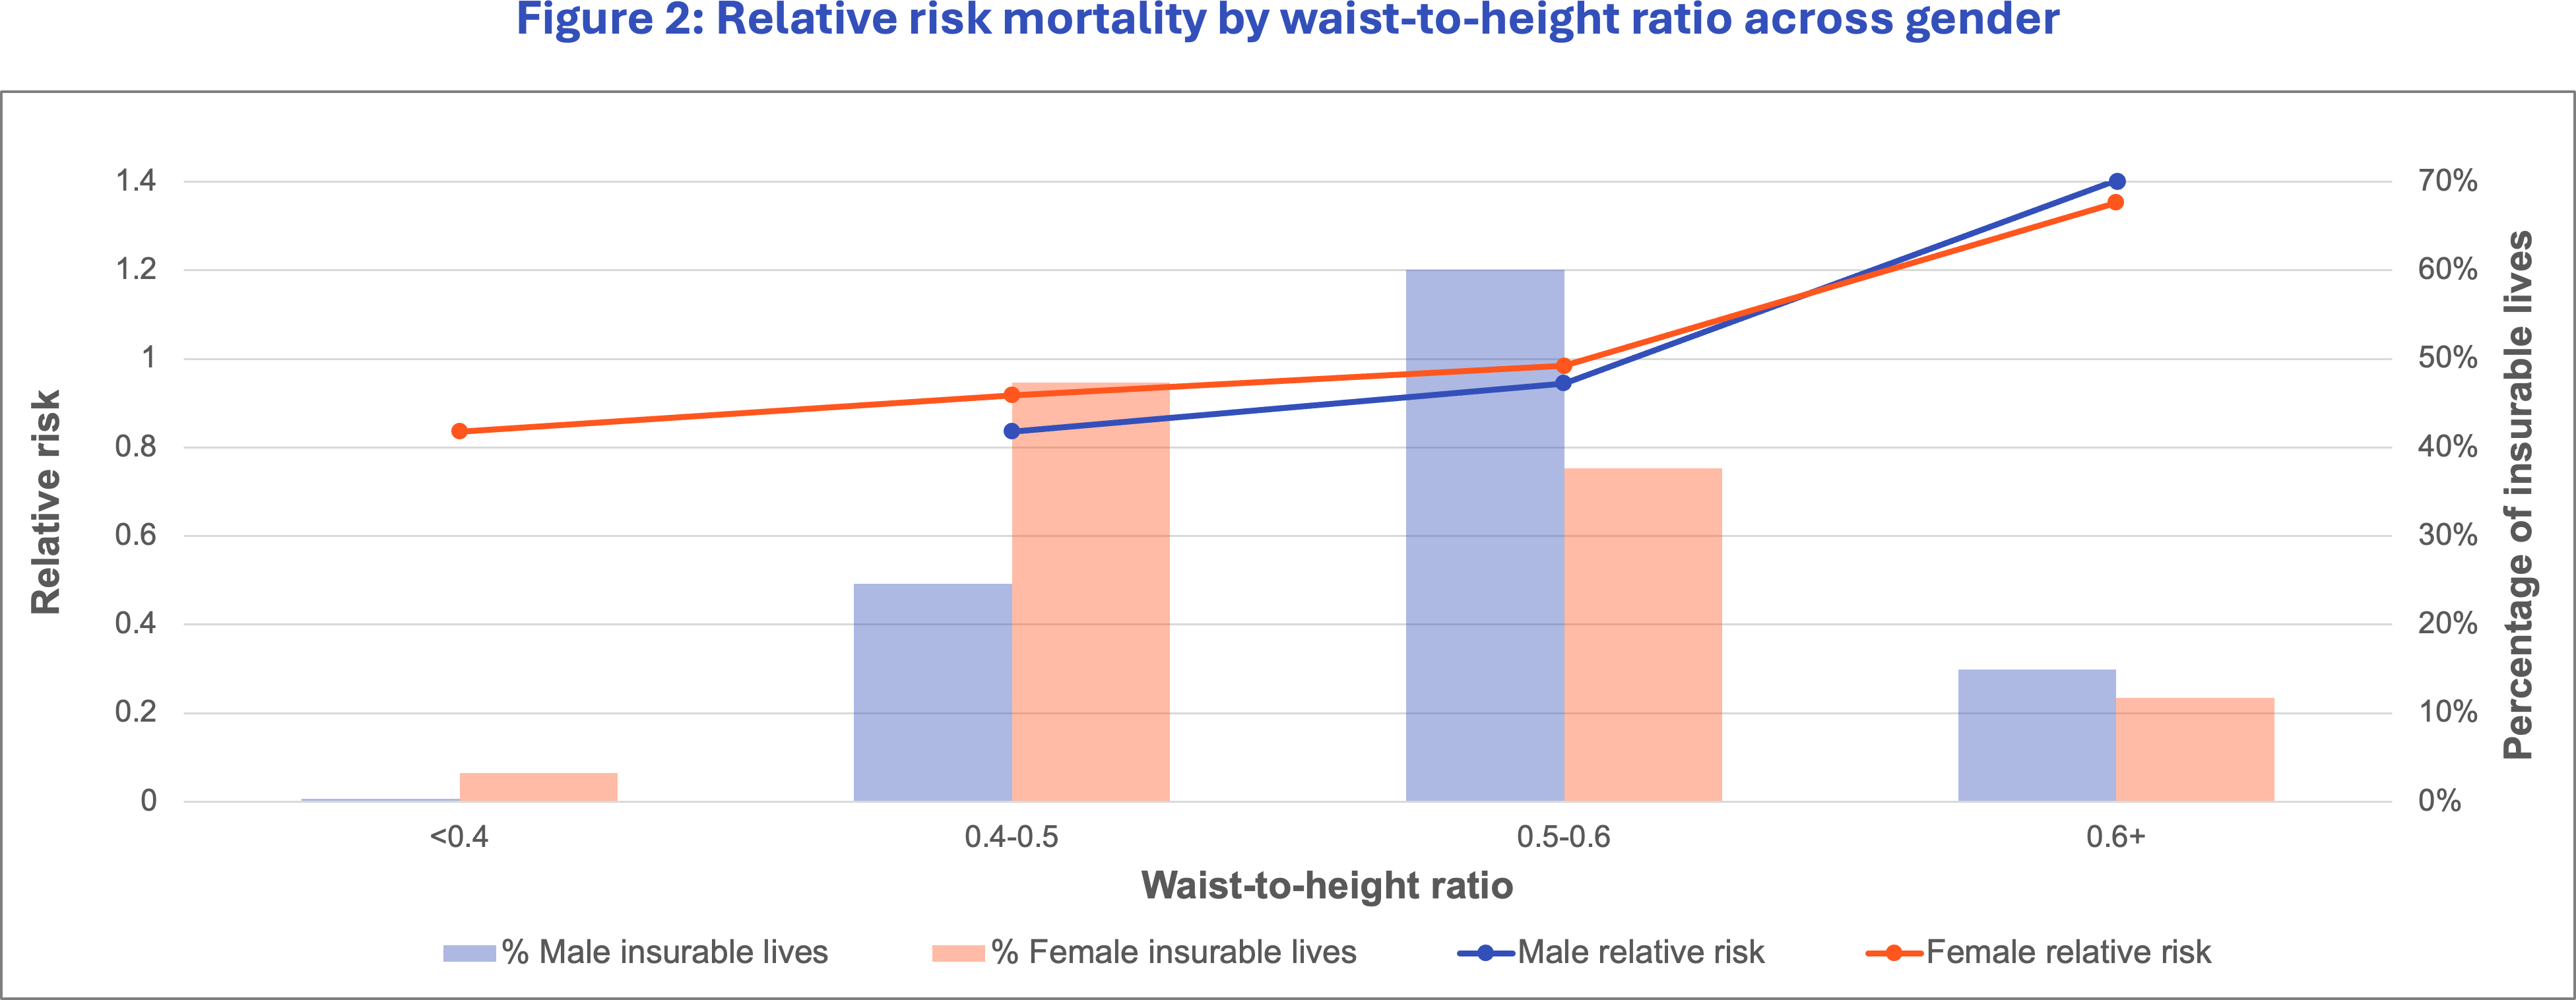
We focus on waist-to-height ratio as it shows promise in mortality segmentation from Table 1, and the median waist-to-height ratio is roughly similar between males and females. Although waist-to-hip and waist circumference show evidence of mortality segmentation, their distribution for males and females differ and would likely require different thresholds for meaningful analysis. In addition, waist-to-hip ratios involve obtaining an extra measurement, hip circumference, which may be a potential source of error. Thus, waist-to-height ratio is easier to analyze and generalize across genders. This is confirmed in Figure 2, where we see that the relative risk curves are roughly similar between males and females. We remove the under 0.4 waist-to-height ratio for males due to lack of credibility in this group. Therefore, waist-to-height ratio was our first choice for analysis as a supplementary measure to BMI.
Around half of females and a quarter of males have a waist-to-height ratio between 0.4 and 0.49, defined as the healthy range.4 A ratio between 0.5 and 0.59 is elevated risk, and above 0.6 is highest risk, with an increased chance of cardiovascular disease. We see that waist-to-height ratio stratifies mortality risk, and there is an associated higher mortality risk for the high ratio group.
Considering BMI and waist-to-height ratio together
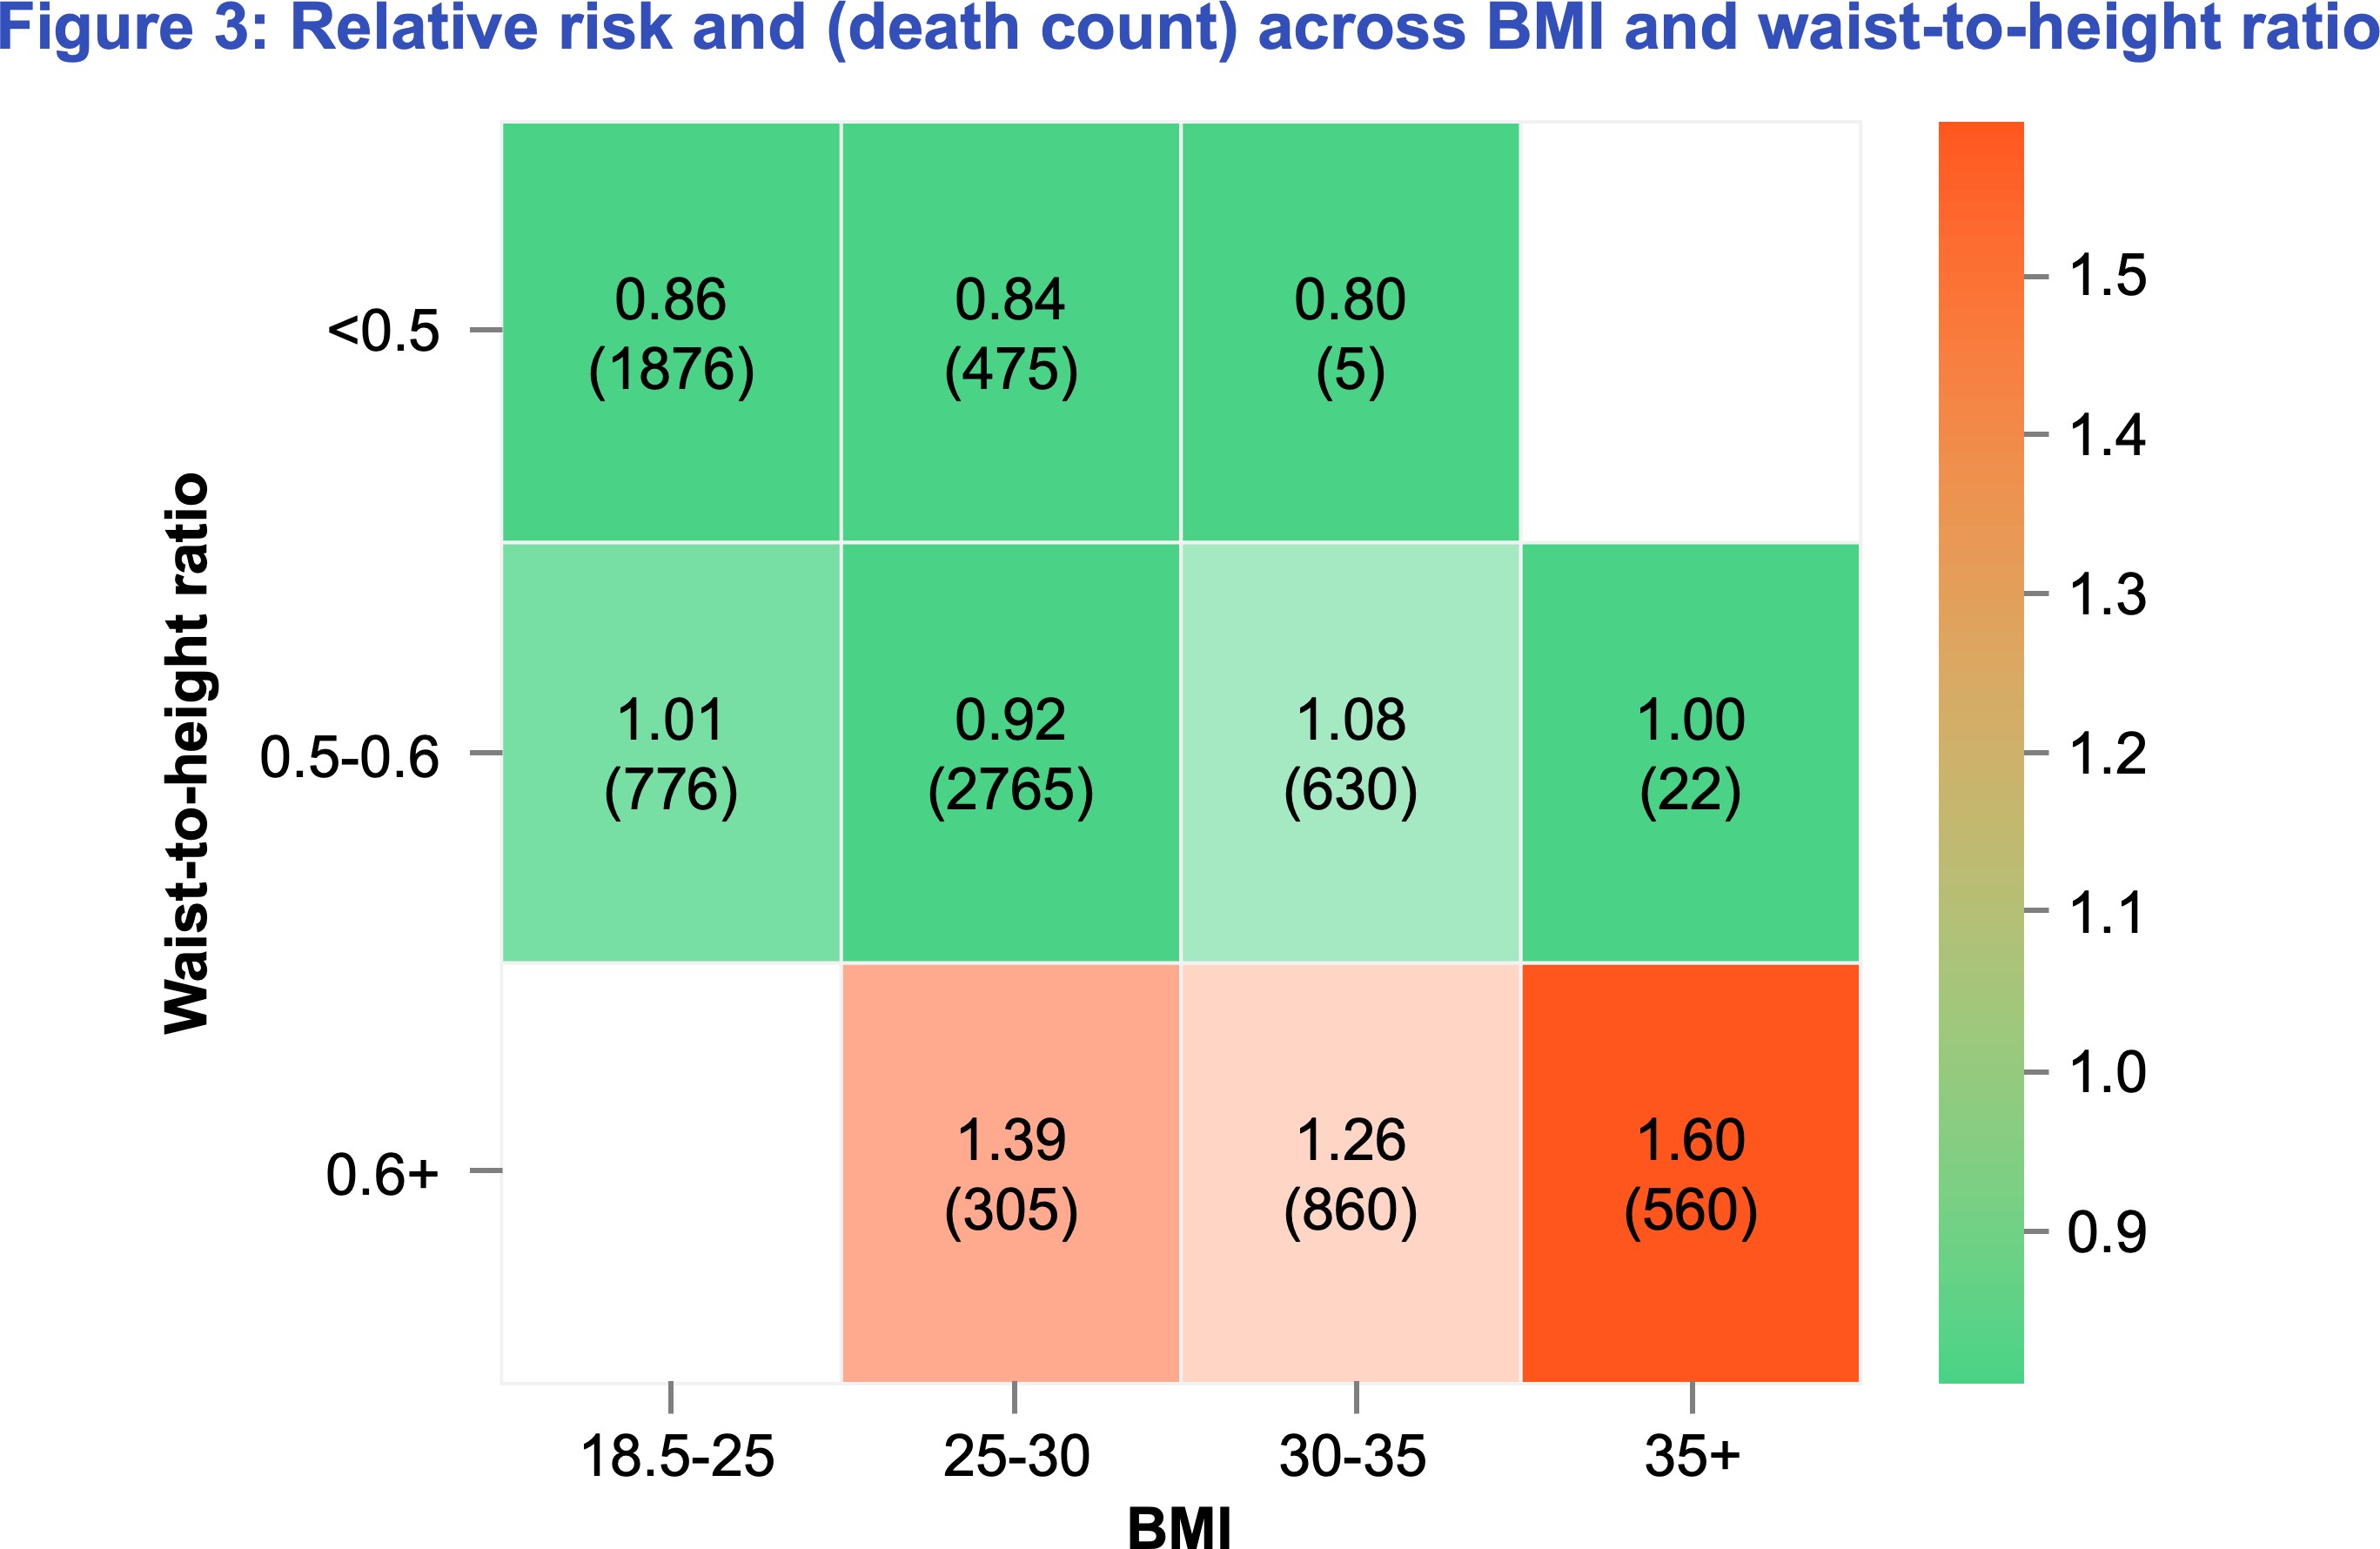
We note from Figure 3 that the combination of waist-to-height ratio and BMI allows us to better segment mortality risk than BMI alone, and segmentation can be seen across all BMI groups In fact, individuals with an overweight BMI but healthy waist-to-height ratio have 15% lower mortality risk than those with a healthy BMI but unhealthy waist-to-height ratio. Within the 25-30 BMI category, we see that the healthy waist-to-height ratio of under 0.5 has a mortality risk 40% less than the unhealthiest waist-to-height ratio of 0.6+. Thus, waist-to-height ratio can offer additional mortality risk segmentation even after controlling for BMI.
We can use waist-to-height ratio to identify low mortality risk individuals in the overweight BMI category. In fact, individuals with an overweight BMI but healthy waist-to-height ratio have 15% lower mortality risk than those with a healthy BMI but unhealthy waist-to-height ratio.
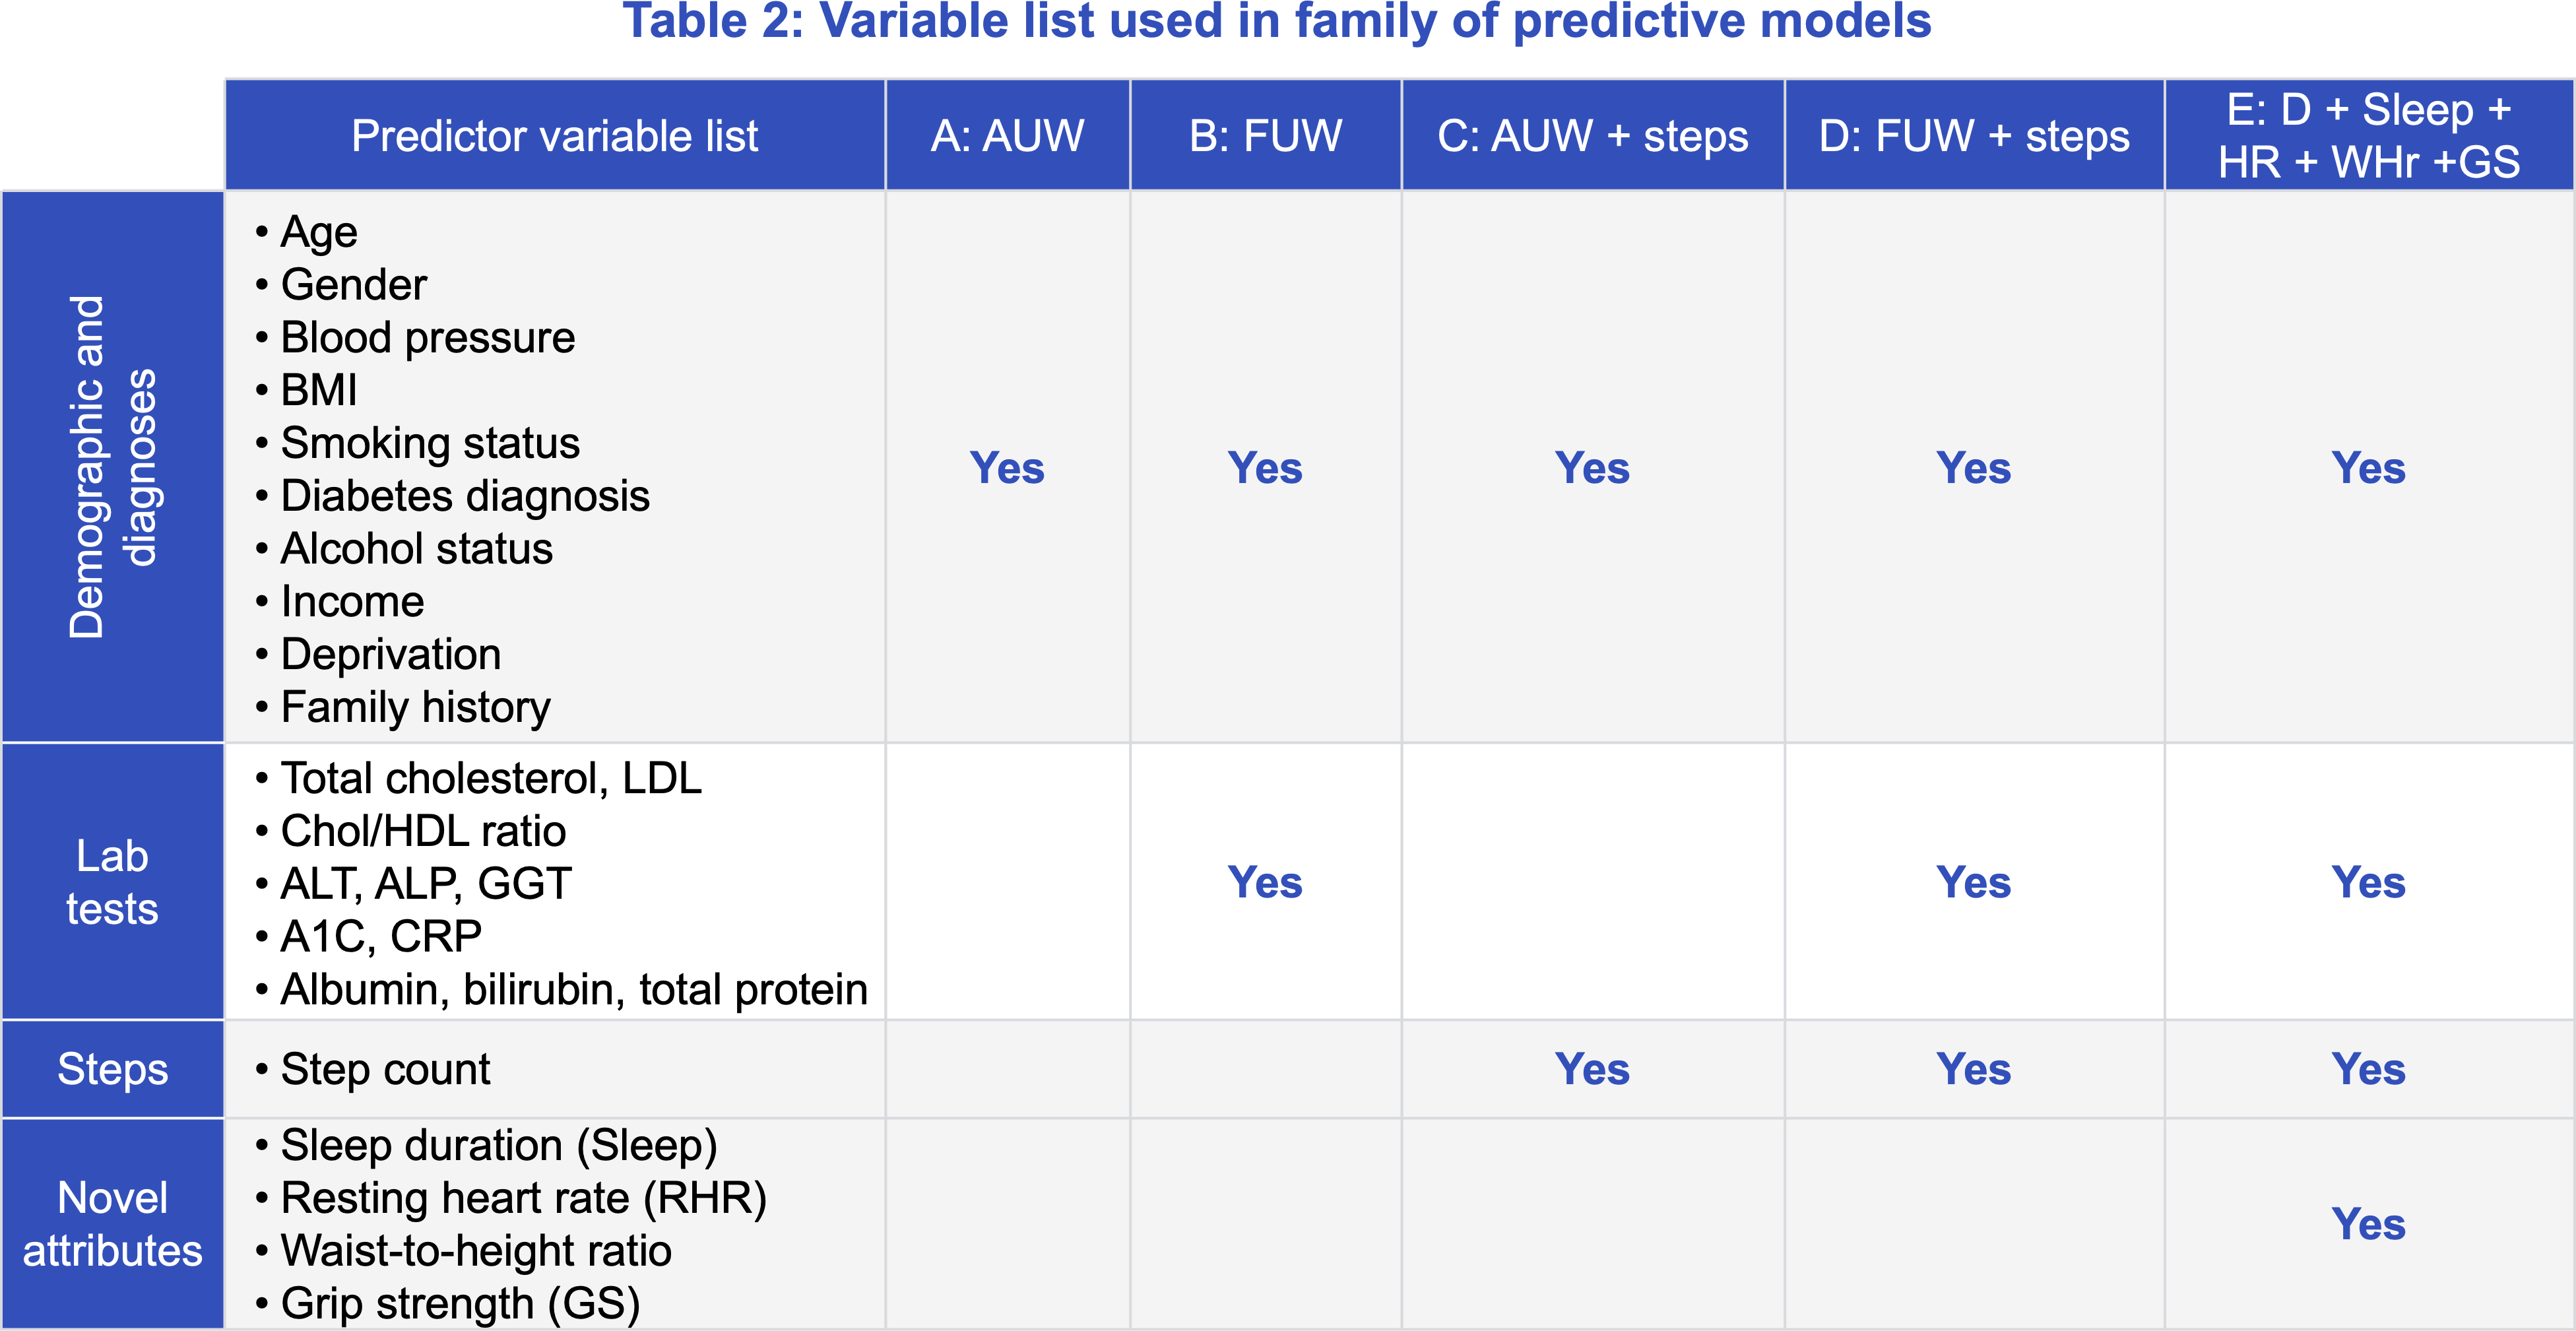
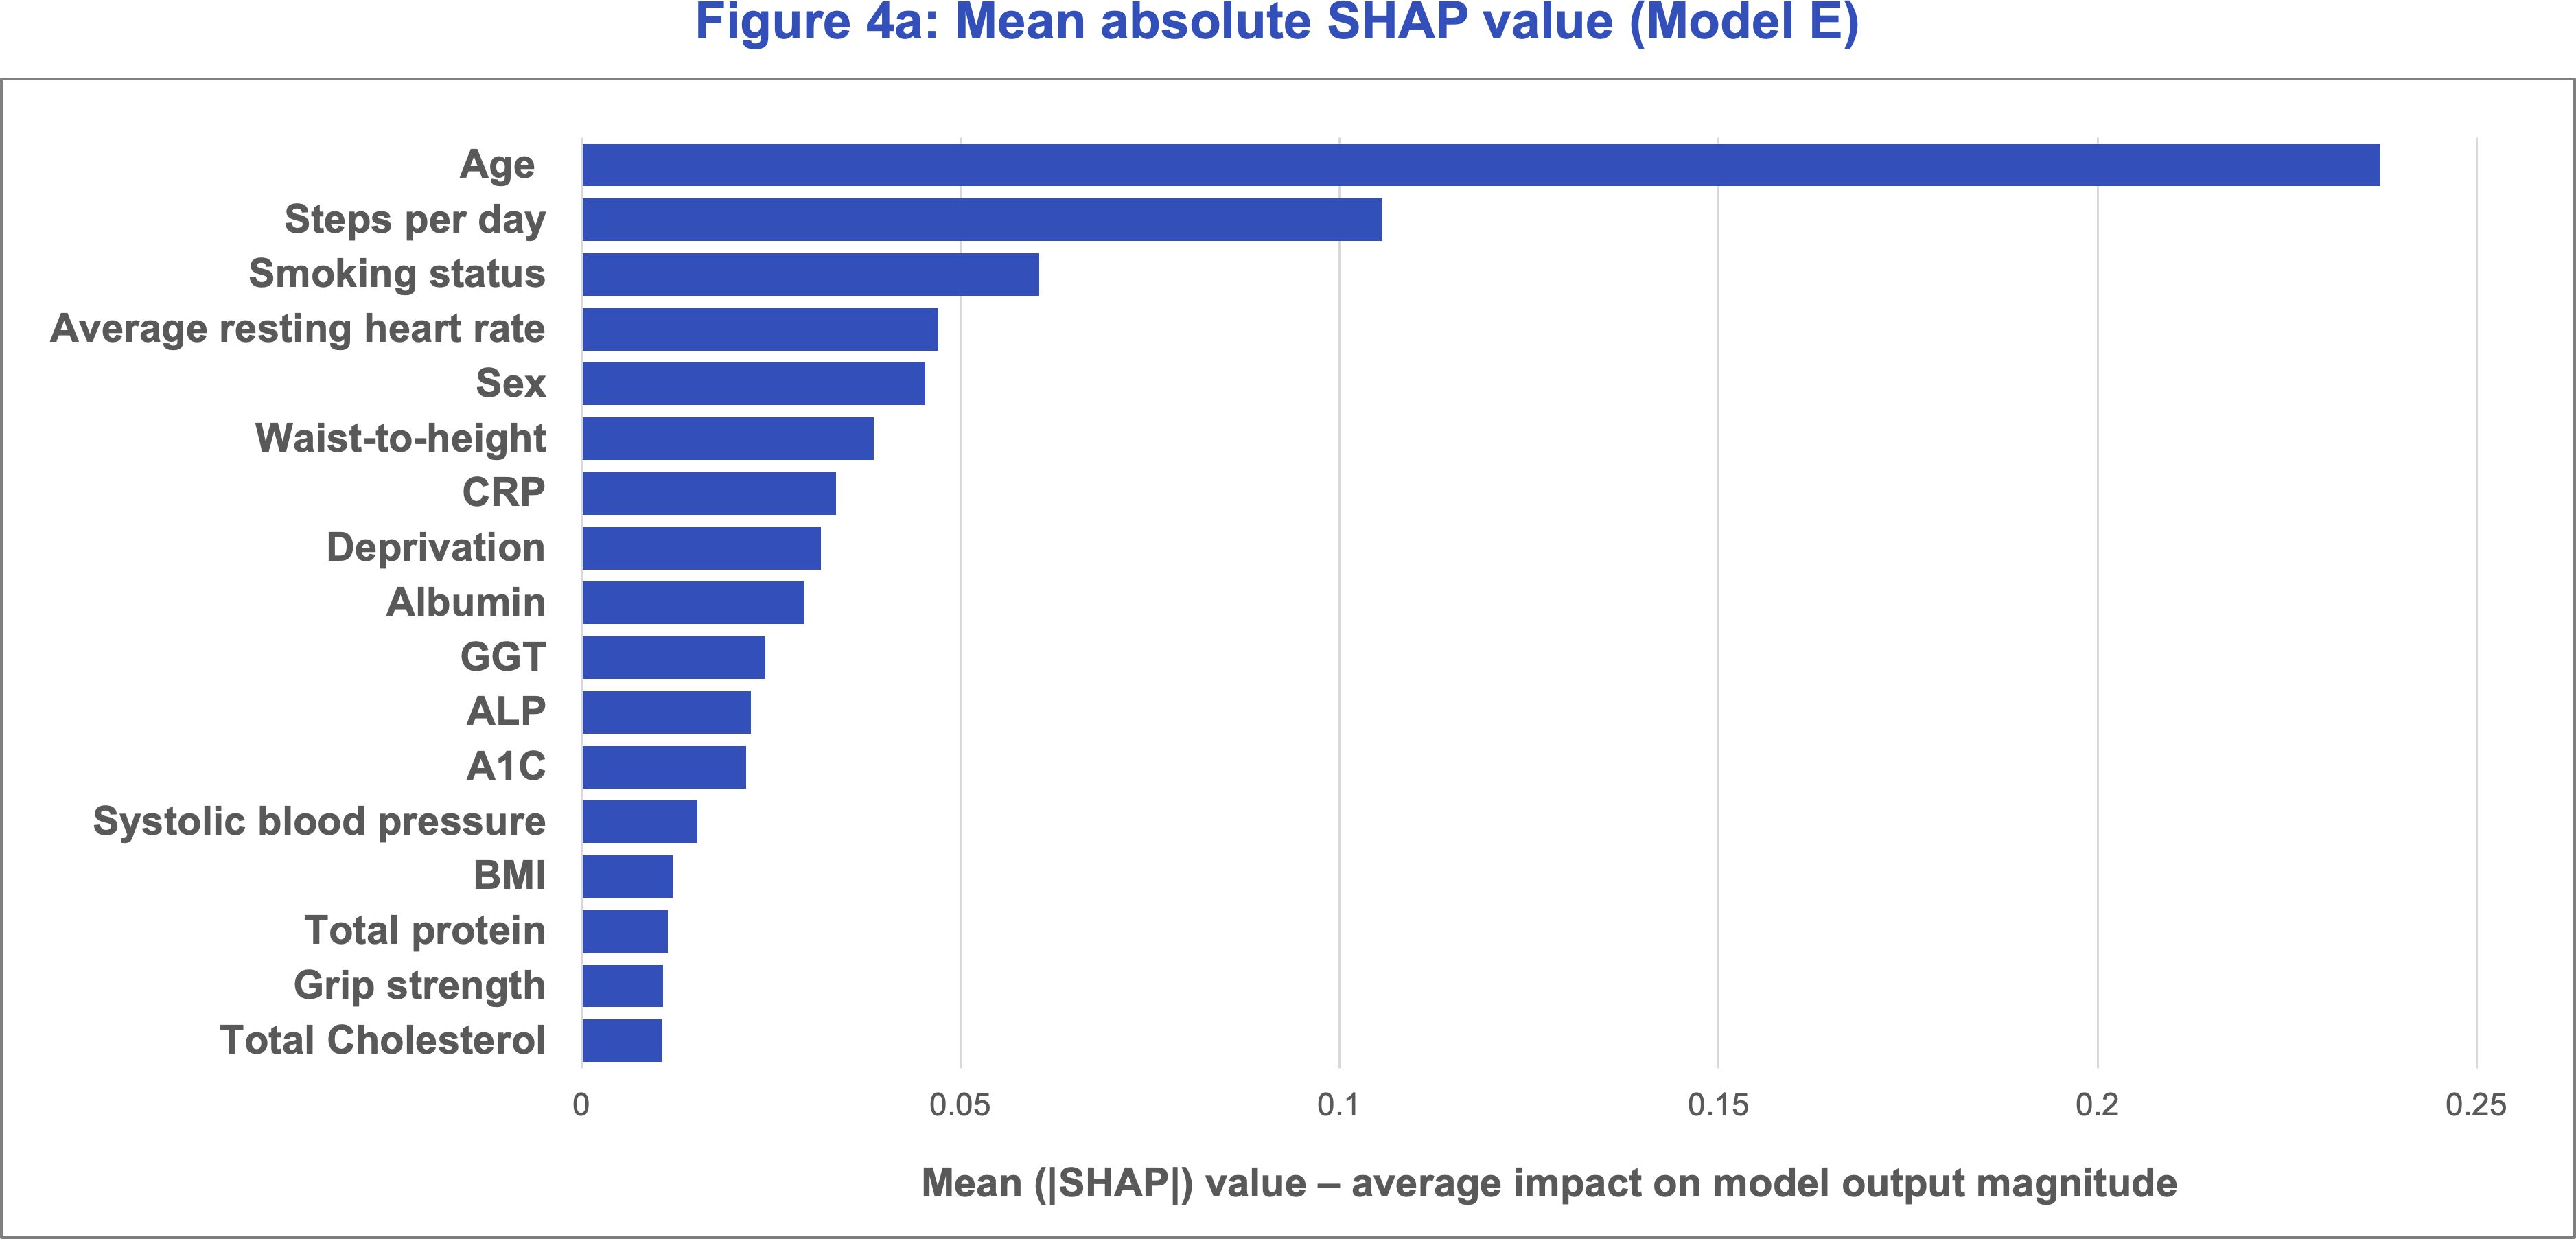
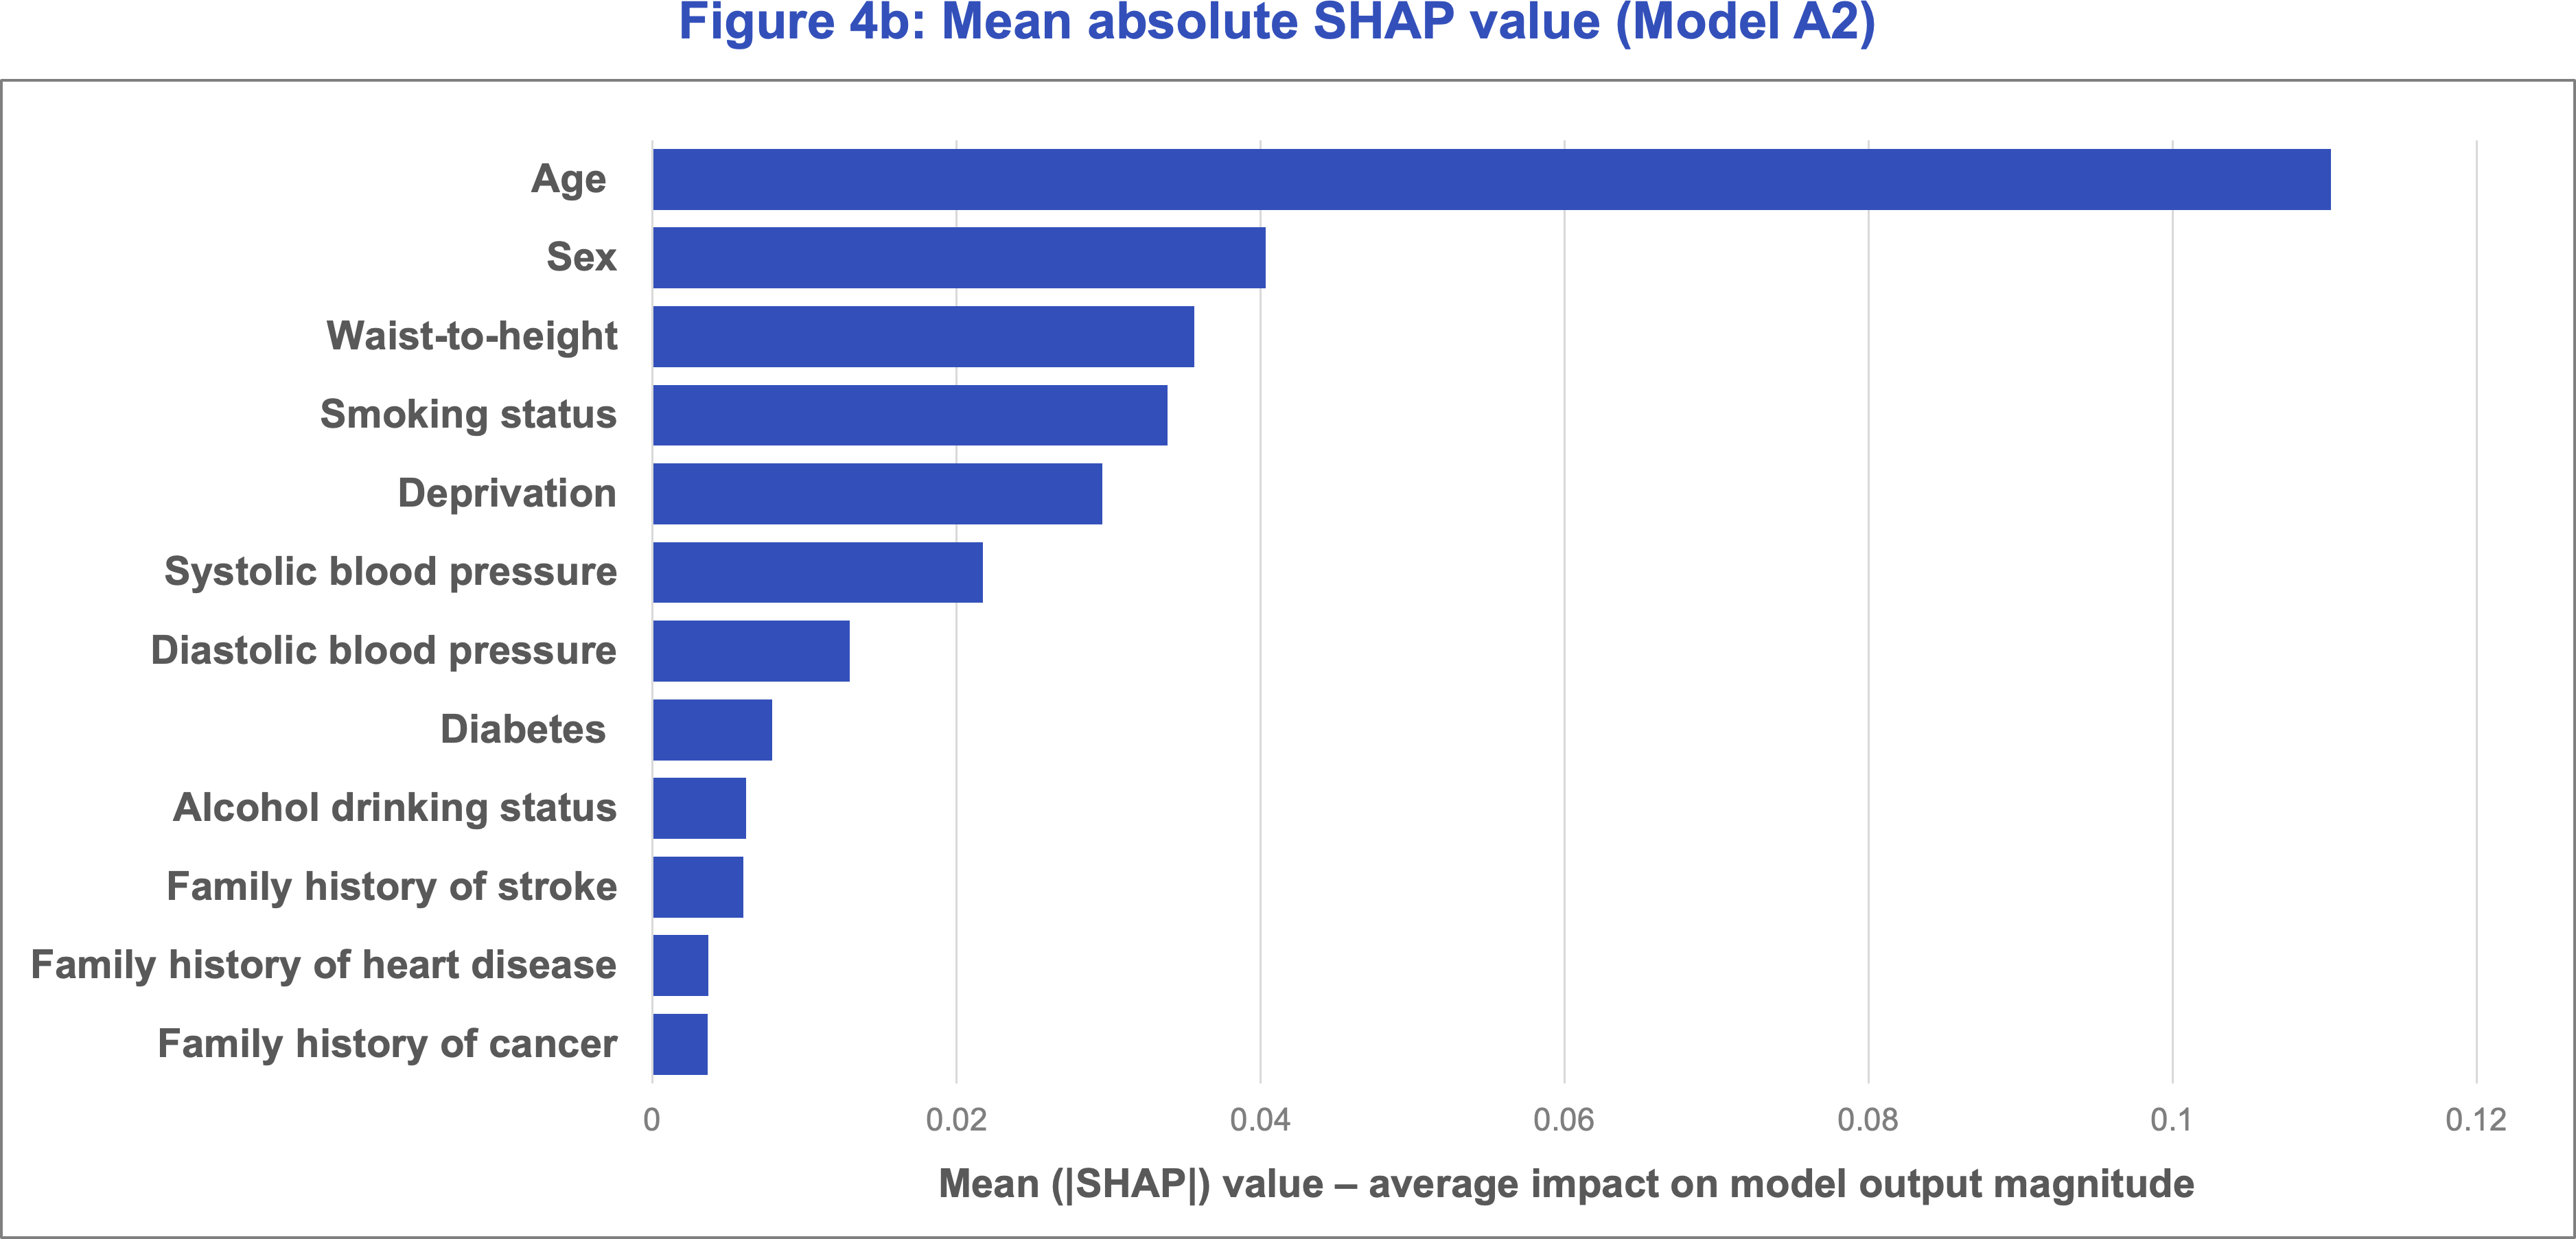
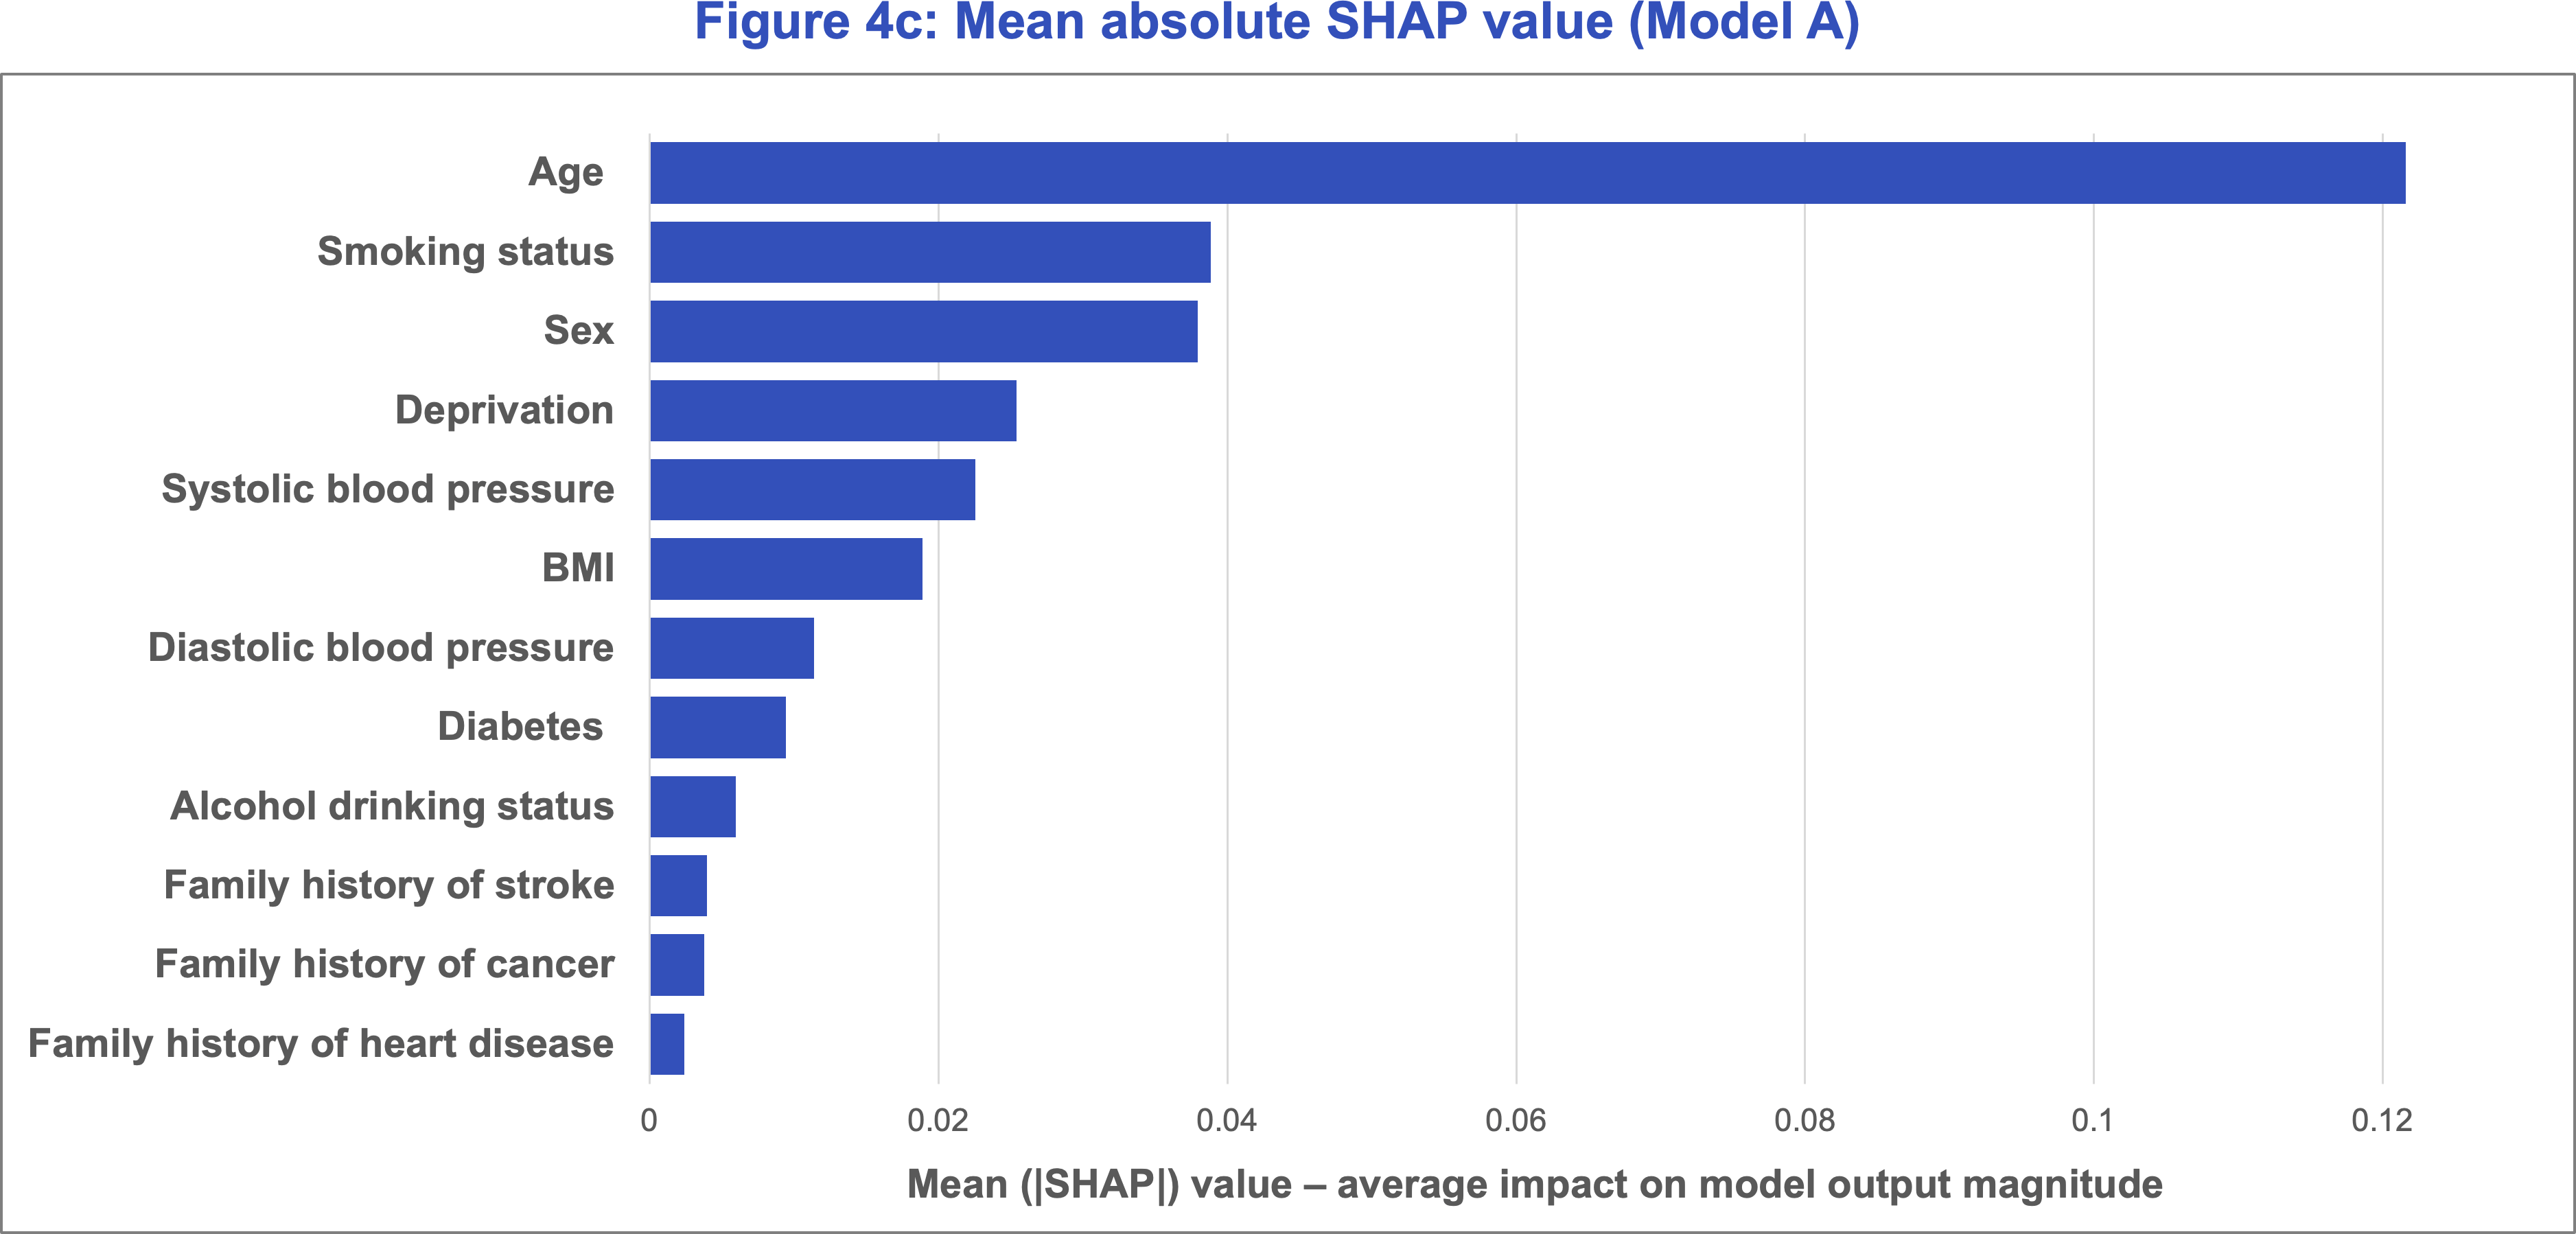
As in our previous study, Klarity trained its mortality models on different subsets of variables to proxy various underwriting scenarios. The variables used in the models are listed below in Table 2. We focus on Model E, which includes all attributes intended to proxy the fully underwritten (FUW) scenario and adds in the novel attributes that are not currently considered in life insurance underwriting, including step count. This allows us to directly compare the significance of these attributes in predicting mortality.
Conclusion
Based on our analyses of the UK Biobank dataset, we conclude that there is strong evidence that waist-to-height ratio can effectively segment mortality risk on top of BMI and can be used to identify high-risk individuals across all BMI categories. This is also true for other measurements such as waist-to-hip and waist circumference. Note that these conclusions were drawn on a UK population, which has a lower prevalence of overweight and obese individuals than the US; in 2022, 26.2% of UK adults are estimated to be obese5 compared to 40.3% of US adults.6 Given the US has a higher proportion of obese lives than the UK, adding a metric like waist-to-height ratio has an even greater value add in stratifying out healthier lives in typically substandard or declined BMI categories. The higher percentages of overweight and obese individuals in the US imply a greater need to effectively classify mortality risk in these BMI categories.
However, it is important to note that these physical measurements require controlled conditions for accurate measurement, making their widespread use in life insurance underwriting more challenging. Carriers looking to adopt these measures into their underwriting processes can start by piloting programs to collect data, assess customer participation rates, and gain insights into how these attributes are distributed across their insured population. Such pilots serve as a practical step toward evaluating the feasibility and value of integrating these novel measures. Munich Re Life US has experience in developing and monitoring such programs and can work with carriers through incorporating these newer variables into their existing underwriting.
References
Contact


Related content
Newsletter
properties.trackTitle
properties.trackSubtitle


