
In a recent survey conducted by Munich Re, over 90% of underwriters surveyed reported that they were concerned about the potential impact of opioid addiction on mortality for the life insurance population.1 To help address these concerns, insurance laboratories in mid-2017 introduced expanded screening protocols for both prescription and illicit opiates in order to help the life insurance industry improve the risk selection process in light of the current opioid epidemic. This crisis is well-publicized with the often quoted CDC statistic that “overdose deaths involving prescription opioids have quadrupled since 1999.”
The question we hear from underwriters is: is it financially feasible to screen all life applicants for opioid use?
The goal of this paper is to help put these concerns in context by exploring the various screening options and provide a cost-benefit analysis that can assist underwriting departments in determining when to use such screening tools.
Blood profile screenings
Recently, the insurance laboratories have started to offer expanded screening protocols for opioids. There is one screening protocol for the natural opioids: Morphine, Codeine and Heroin. However, since the synthetic and semi-synthetic opioids have different chemical structures, additional screening protocols had to be developed to detect them. Additional screening is now available for methadone, hydrocodone, oxycodone and fentanyl.
With new screening options available, it is up to underwriting departments to determine how to implement them into their underwriting guidelines. From a financial point of view, it would be beneficial to implement the new screening protocol only for ages and risk classes where the expected savings from claims costs are more than the cost of the test itself. The cost of the full opioid panel is approximately $12 per application, but how do we calculate the expected claims savings?
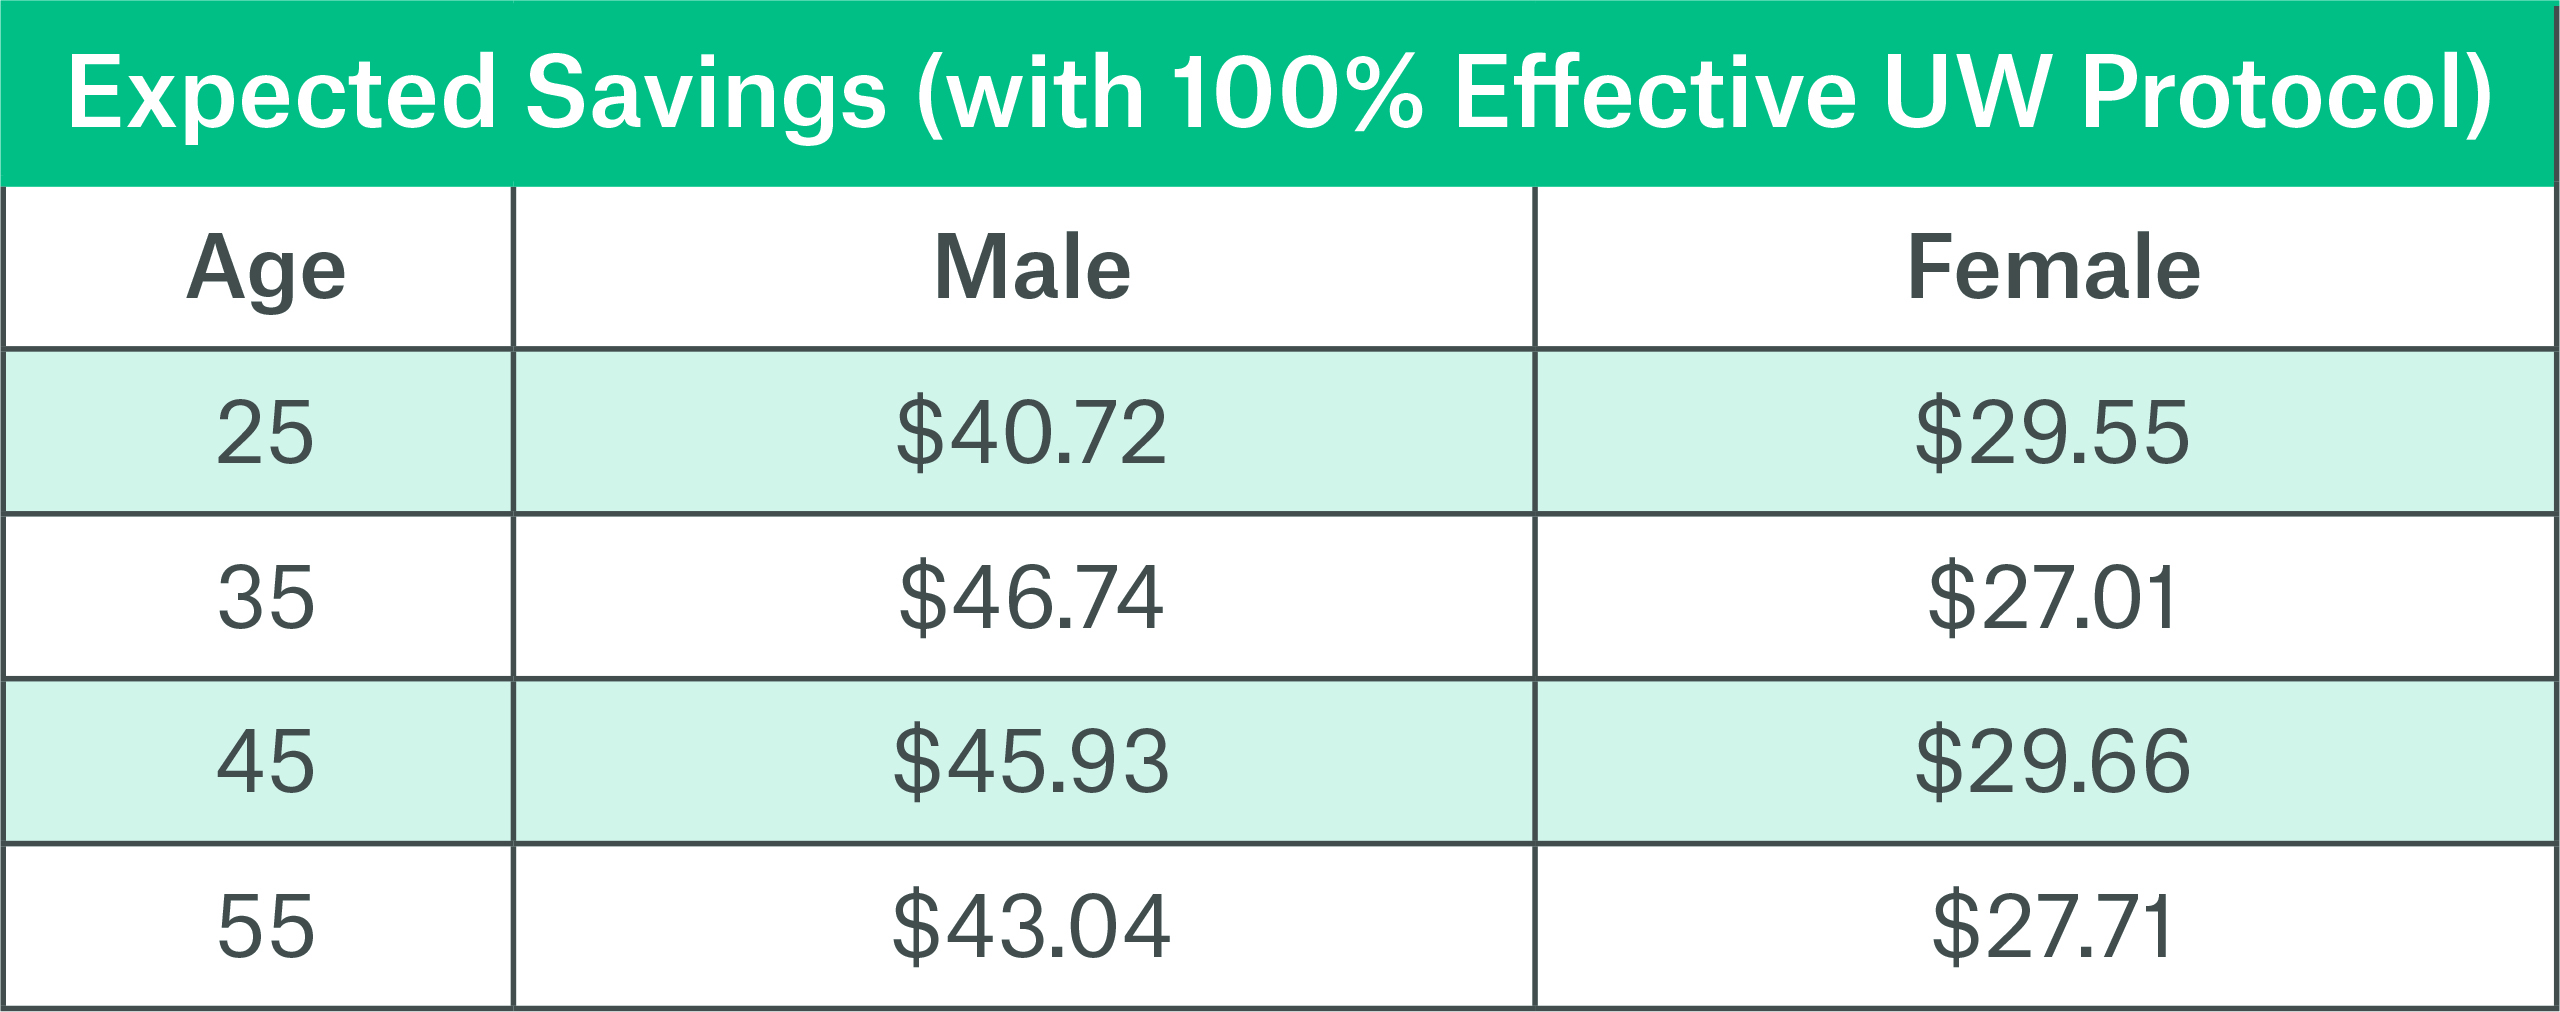
As a starting point, we used CDC population mortality data2 to estimate the implied claims savings under a best case scenario where the new underwriting protocol was 100% effective at declining risks associated with opioid overdose.3 Chart 1 shows the expected savings over 10 policy years4 for a $100,0005 life insurance policy.
Chart 1
Fully Underwritten Market
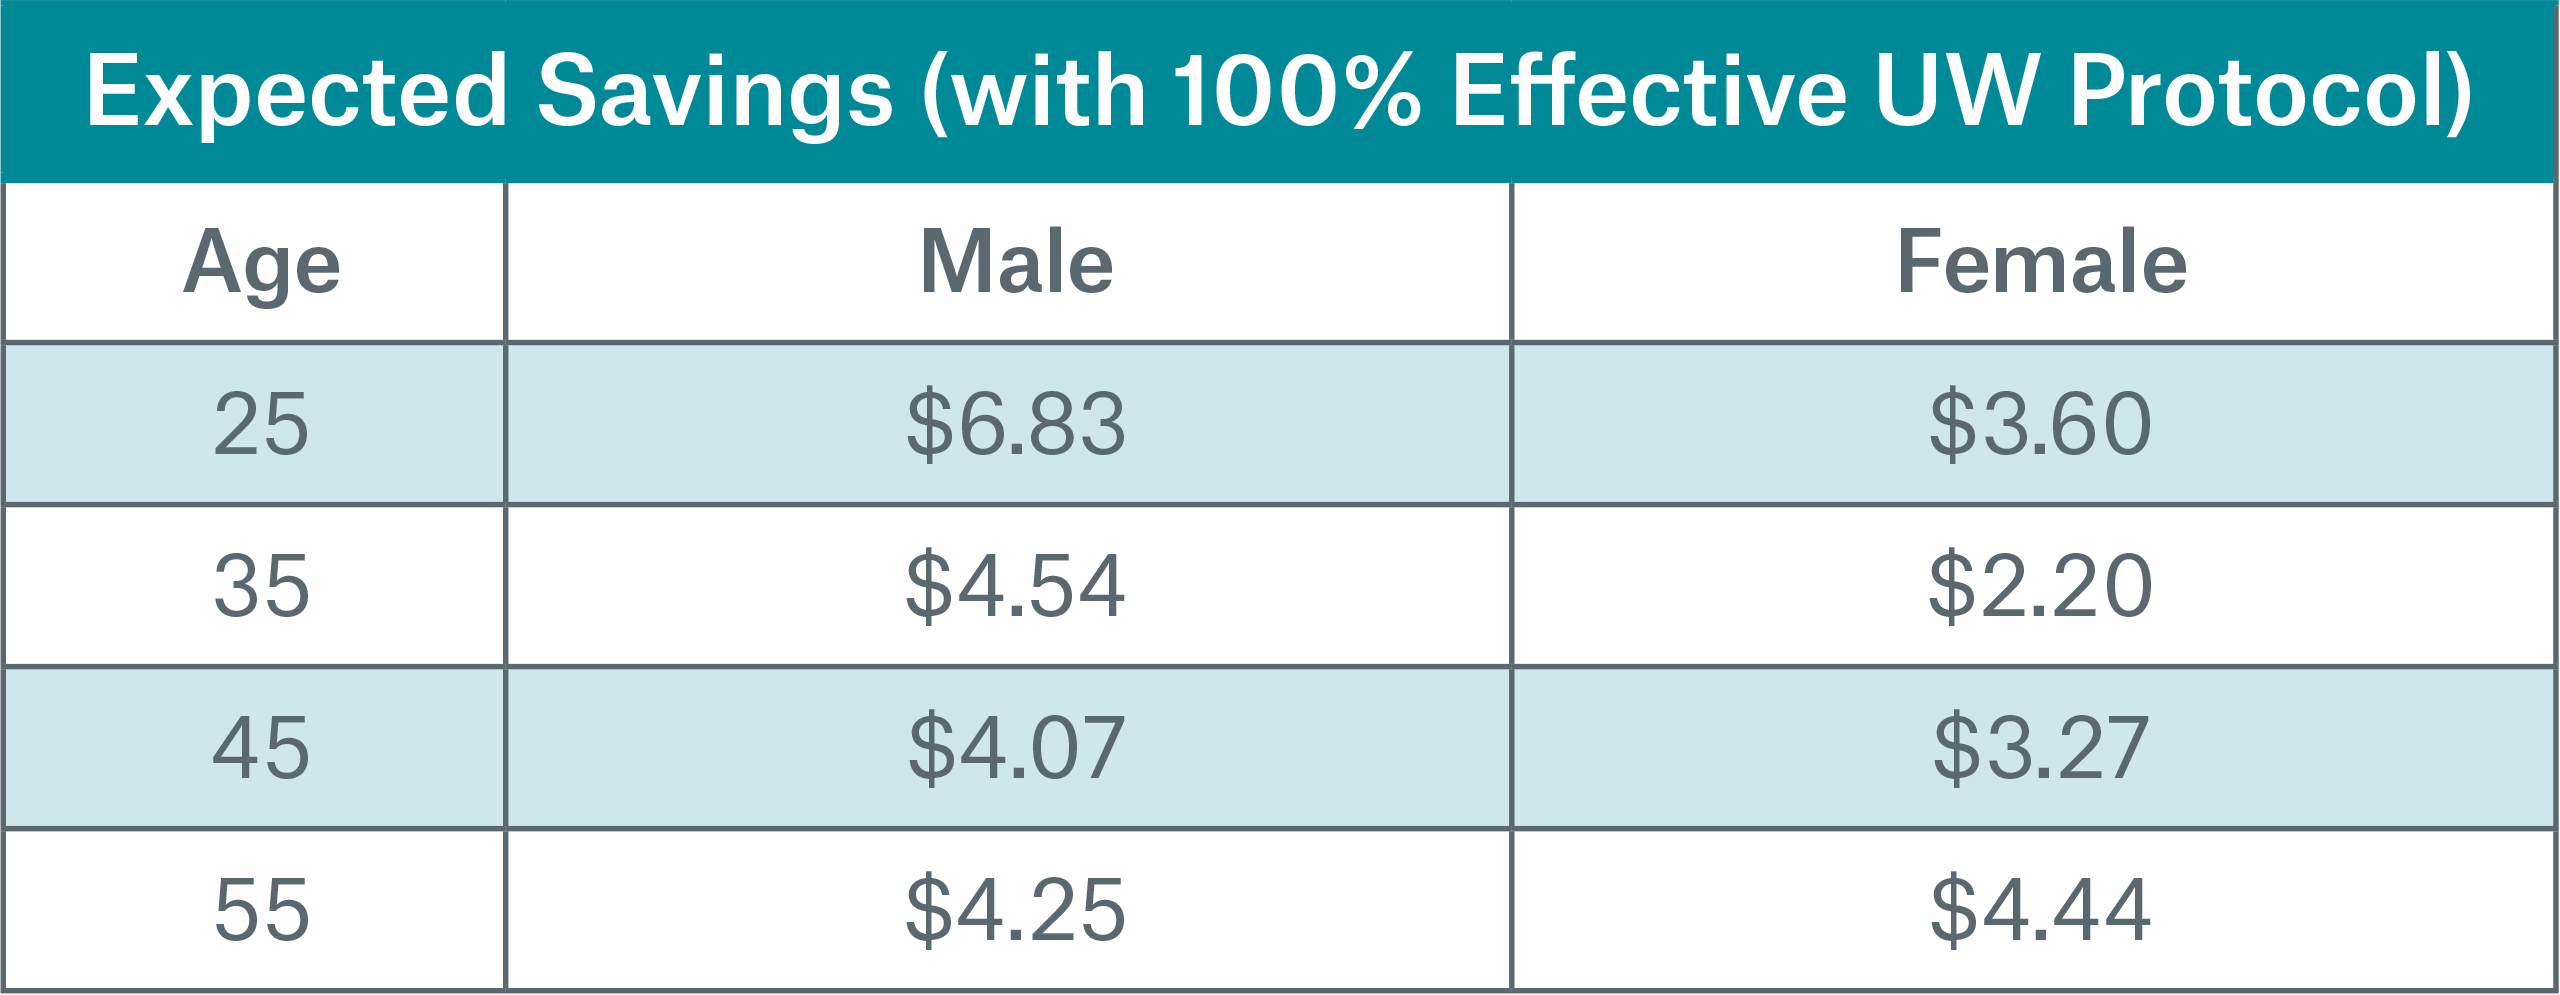
To calculate the impact on the insurance population, we used Munich Re’s own insured mortality experience7 which included over 1,400 claims due to overdose in order to estimate the claims savings in a best case scenario where the new underwriting protocol was 100% effective at declining risks associated with opioid overdose in the first year. Chart 2 shows the expected savings over 10 policy years for a $100,000 life insurance policy.
As can be seen, the expected savings is considerably lower than that of the example based on general population statistics and somewhat less than the cost of the drug screening itself. However, we cannot immediately conclude that there are no uses for these screenings.
Chart 2
Smokers
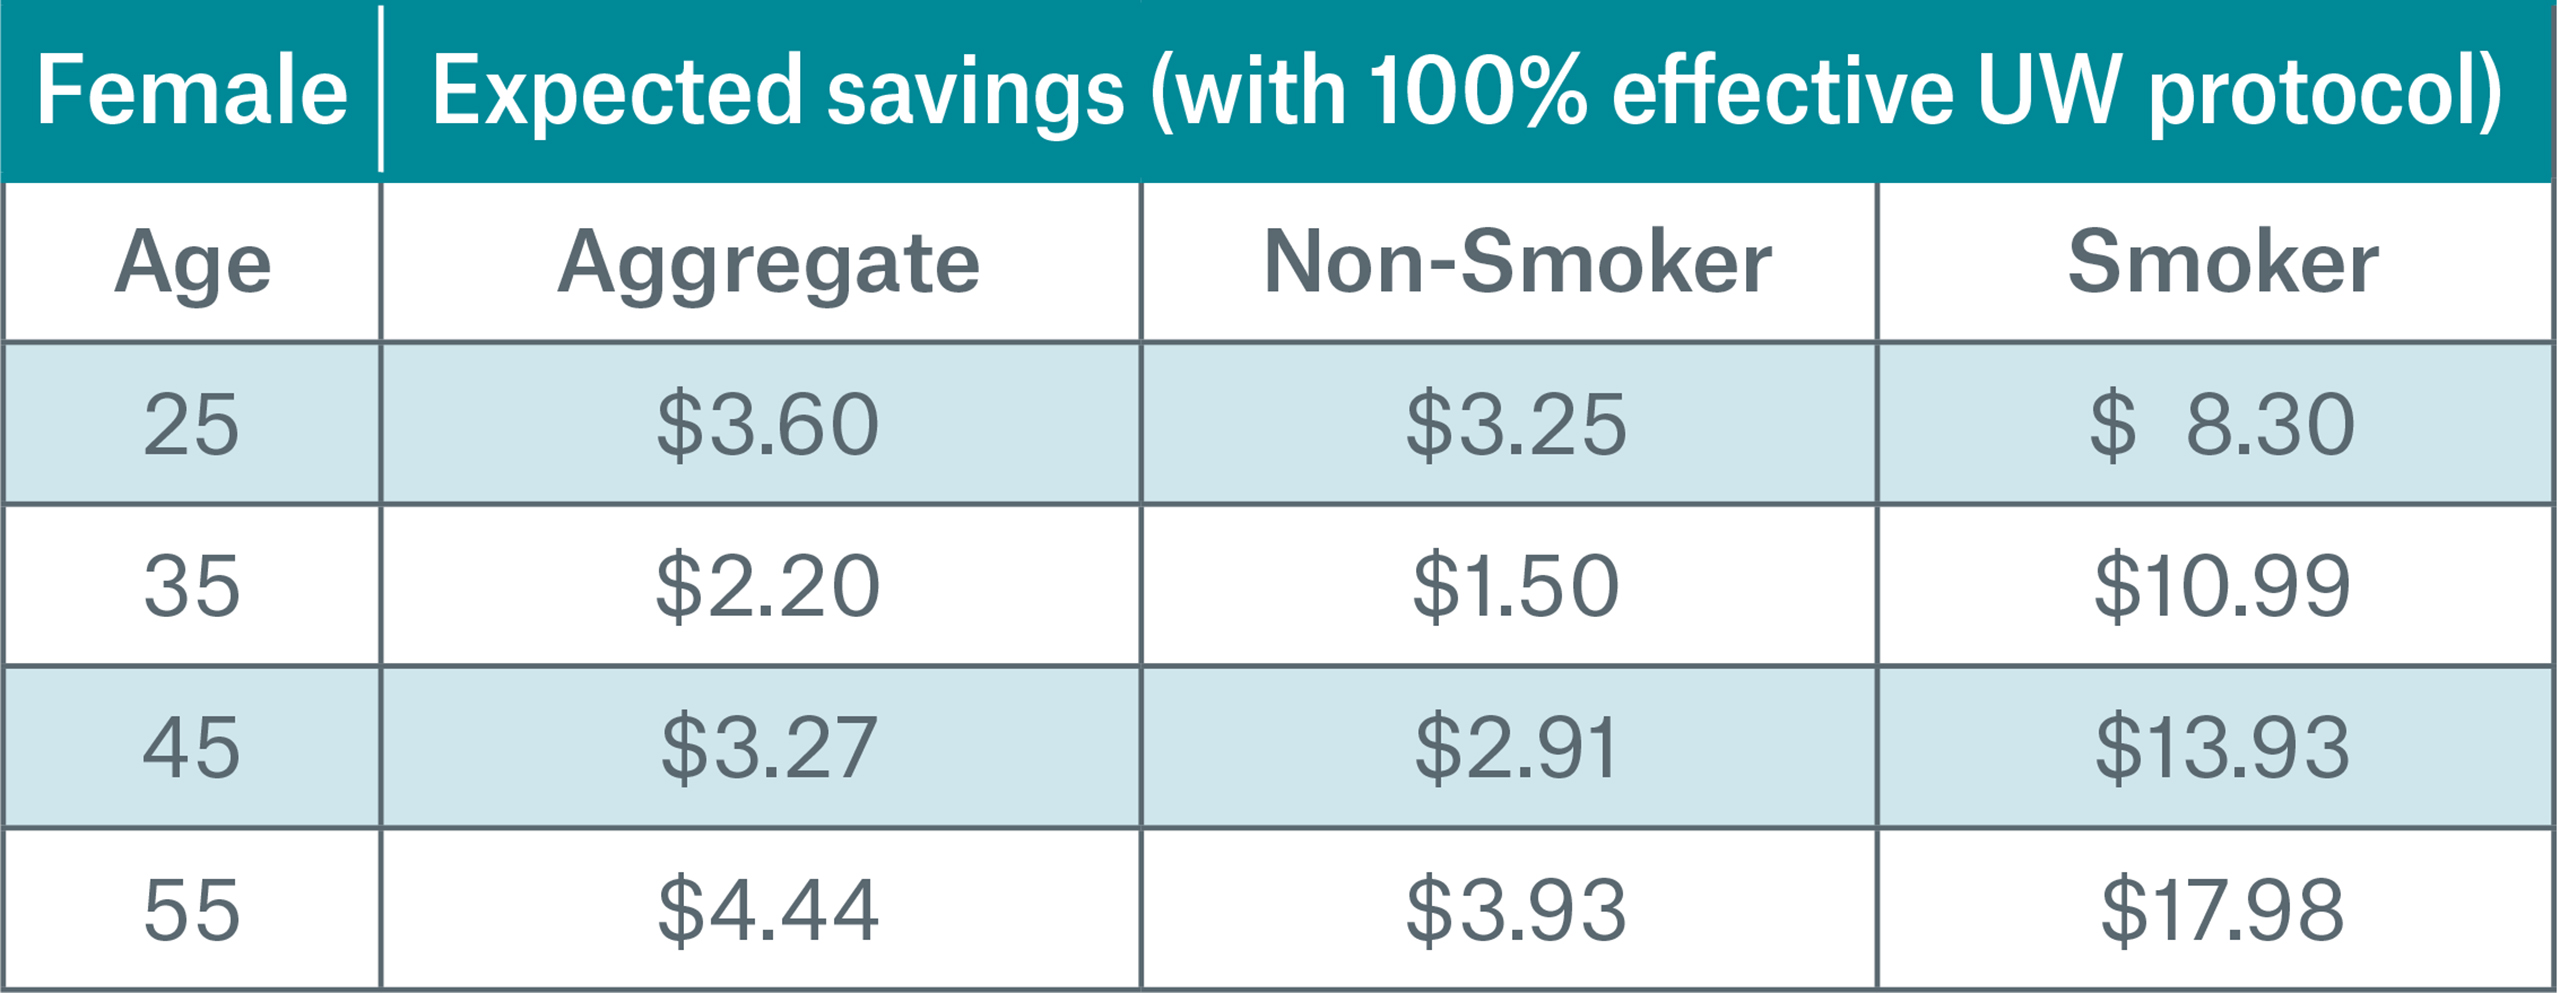
Although there might not be a cost savings for including opioid screening across the entire portfolio, that does not mean that there aren’t pockets where screening could be beneficial. If we look at this same data split by smoking status, we see a significant difference in the cost savings for smokers verses non-smokers. At most ages affected by the epidemic, the expected claims savings for smokers is higher than the cost of the screening protocol (approximately $12).
Charts 3-4 show the same scenario as before, only now we see the results on a smoker distinct basis.
Based on these results, one recommendation might be to implement a reflexive opioid screening on all applicants who have a positive cotinine test.
Chart 3

Chart 4
Middle Market
We have seen the significant difference in the set of results based on general population statistics compared to the set based on life insurance claims experience. Part of this difference is explained by the socio-economic makeup of the insured population.
When we subdivide the general population into socio-economic strata (using education as a proxy), both mortality and cost savings decreases as you move up the socio-economic ladder.6
This can be seen in Charts 5-6 where the college educated population is compared to the general population and to the insurance population. The college educated subgroup of the general population exhibits mortality levels similar to the insured population, but not quite at the level of the insured population in early policy durations. The remainder of the difference can partially be explained by the benefit that is being derived by traditional underwriting during the initial years of the policy.
Chart 5
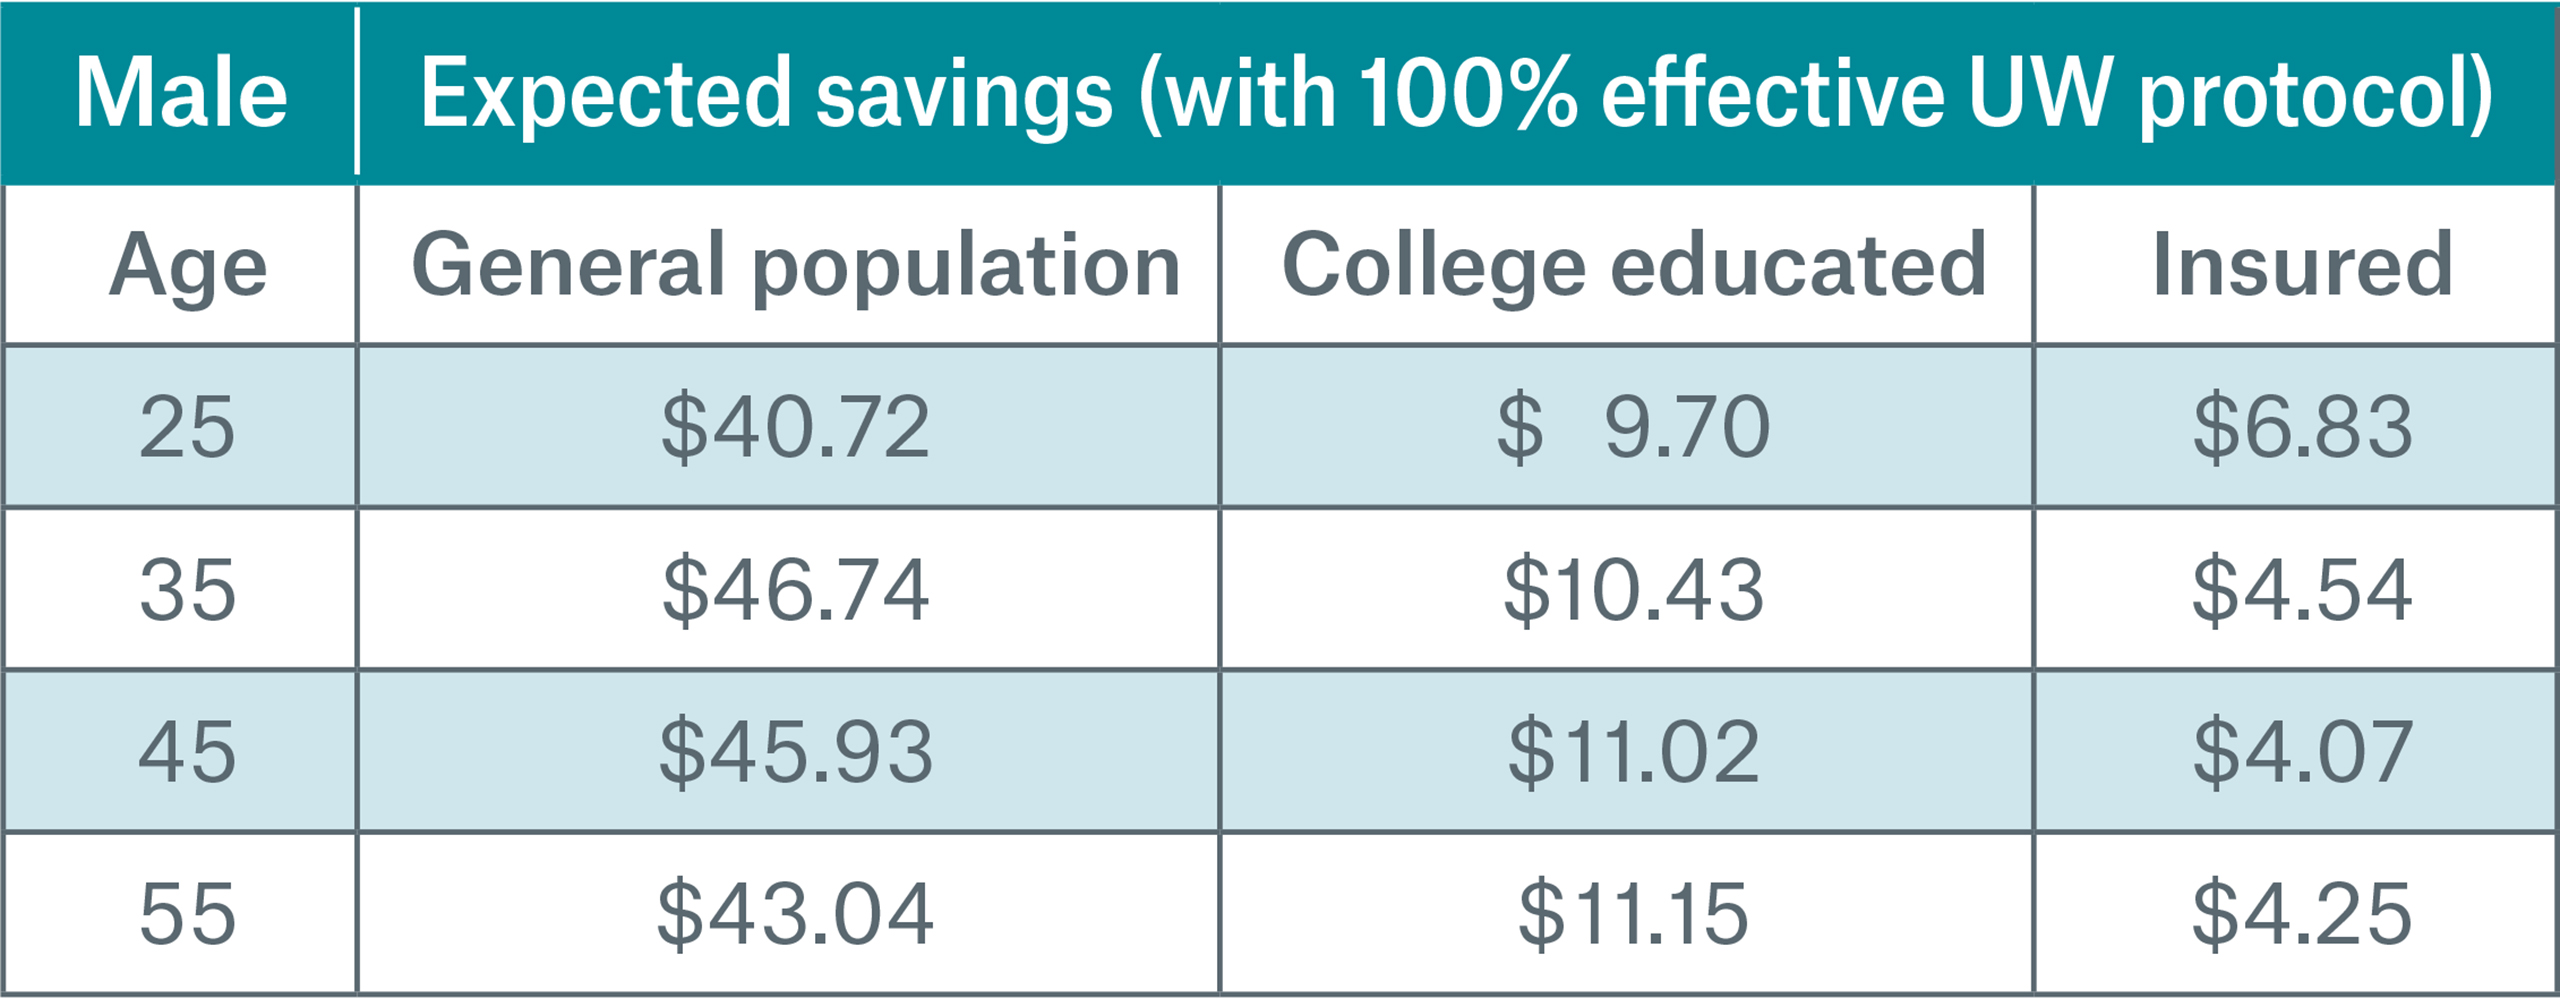
Chart 6
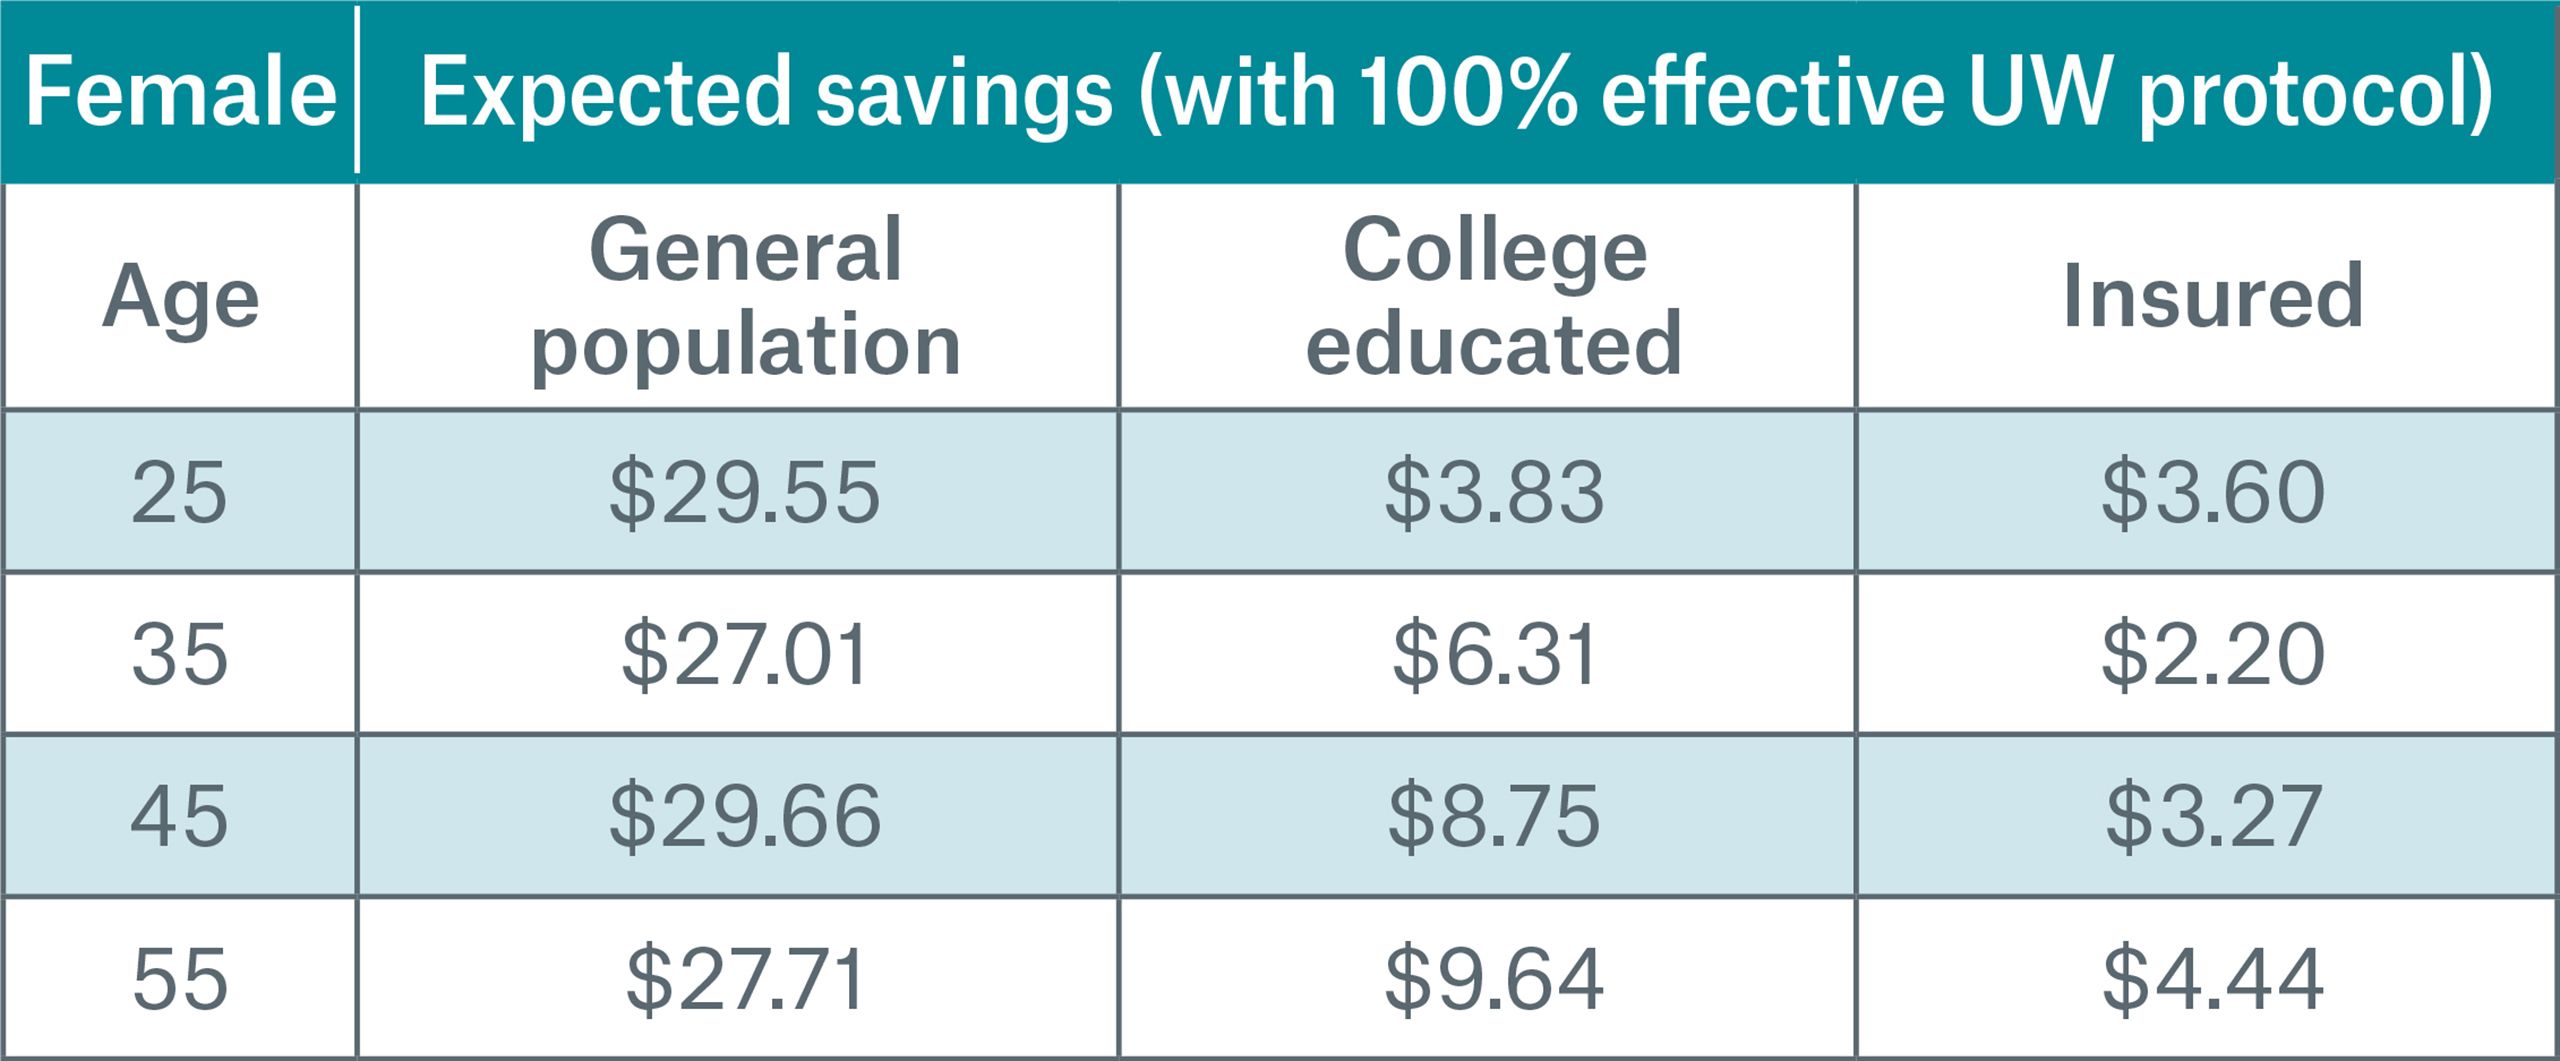
However, as the industry tries to capture the middle market and move away from fluid underwriting towards accelerated or automated underwriting processes, these conclusions may not continue to be valid. Under these programs, new target markets may exhibit a different mortality level due to both the socio-economic effect and the change in the selection benefit from the more streamlined underwriting process.
Another consideration is that even if these screening protocols are 100% effective at determining if someone has used opioids recently, it will not automatically follow that the person is at risk of addiction or death. Thus the effectiveness of the implementation of the underwriting protocol will be less than 100%.
Prescription drug database checks
Another tool already at the underwriter’s disposal is a prescription database check including rules and algorithms based on this data. Using these databases, underwriters are able to see recent opioid prescriptions filled for the applicant, but the existence of a prescription for opioids is not in itself a red flag. Underwriters would have to use their judgement in determining if such a prescription was legitimate or potentially being abused. Key items to consider are: overlapping prescriptions from multiple sources, high daily dosage, and history of mental illness or substance abuse.
When discussing the protective value of these databases for the risk associated with opioids, we must also consider from what source those who are at the highest risk of death get their opioids. In the 2015 National Survey on Drug Use and Health only 36% of participants reported that they got their opioids through their own prescriptions.8 This is consistent with the growing trend away from prescription drugs toward cheaper street drugs that are more easily accessible.9
This may indicate that those whose are at most risk of excess mortality due to opioid use do not have recently filled opioid prescriptions. Rather they have already transitioned to illicit sources for the drugs. In such a case, traditional prescription drug databases cannot be relied upon to flag this subpopulation with elevated risk of opioid abuse.
Conclusion
In assessing the benefit of opioid screening tools, it is not as simple as using population statistics to calculate cost savings. When insurance statistics are used in the analysis, the benefit is less clear. There are several risk factors that show evidence that implementation of screening would provide benefits. The most notable include:
- Using opioid screenings reflexively after a positive cotinine test.
- Implementing screening for non-traditional target markets such as the middle market.
- Implementing screening in the triage stages of streamlined underwriting programs (such as random holdouts).
- https://www.munichre.com/us/life/news-and-media/news/2017/Nine-out-of-10/index.html
- Mortality Multiple Cause-of-Death Public Use Record from the CDC
- We assumed this effect wore off linearly over a 20 years period.
- We illustrated the benefit for a ten year term product and we ignored the effect of persistency to simplify the illustration.
- Although $100,000 is illustrated here, cost savings for different face could be estimated from these results using proportions. However, as you move up to higher face amount bands, more medical evidence that is obtained generally which will likely results in less additional benefit being gleaned from the new screening protocol. Hence the benefit diminishes.
- Tim Morant, FSA, MAAA, FLMI, ARA, ACS. “Drug Abuse Mortality in the Insured Population.” Munich Re White Paper, 2017. https://www.munichre.com/site/marclife-mobile/get/documents_E-565929720/marclife/assset.marclife/Documents/Publications/drug-abuse-mortality-in-insured-population.pdf
- This insured experience is from a time when opioid screening protocols were not available.
- Gina Guzman, MD, DBIM, FLMI, FALU. “Opioid Epidemic – How did we get here?” Munich Re White Paper, 2017. https://www.munichre.com/site/marclife-mobile/get/documents_E-1016841552/marclife/assset.marclife/Documents/Publications/Opioid_Epidemic_Origins.pdf
- Gary Haddow, FLMI. “Heroin – the Other Opioid.” Munich Re White Paper, 2017. https://www.munichre.com/site/marclife-mobile/get/documents_E-1308082250/marclife/assset.marclife/Documents/Publications/heroin-the-other-opioid_WP_11-15-17.pdf
Downloads
Contact the Author:

Newsletter
properties.trackTitle
properties.trackSubtitle