
Recent celebrity deaths have brought the topic of suicide out of the shadows and sparked conversation about the causes for suicide and possible preventive measures.
According to the Centers for Disease Control and Prevention (CDC), just over 47,000 lives in the U.S. were lost to suicide in 2017, which translates to 14.5 per 100,000 population.1 In the U.S., suicide ranks in the top ten causes of death for all age groups. Globally, suicide is the second leading cause of death among 15- to 29-year-olds. It is a phenomenon in all regions of the world and is considered a public health priority by the World Health Organization (WHO).2
Another reason for renewed concern about suicides is that they are increasing. From 1999 to 2016, U.S. suicide rates have increased in nearly every state—with 25 states experiencing increases of more than 30 percent.3 Over this time frame suicide rates have increased for both genders and all ages less than 85.1
In order to gain a better understanding of how life insurers are affected by suicides, we performed a study using population data and Munich Re’s internal mortality dataset. To more clearly compare the general and insured population suicide rates we standardized them by age and gender. The study is focused on answering two questions:
- How do general population suicide trends translate into insured experience?
- How do suicide rates vary in the insured portfolio?
Detailed results from the study are incorporated in the body of this paper, which is the first in a series on suicide. Key findings are:
1. How do general population suicide trends translate into insured experience?
- The overall increasing population suicide trend has not translated into the insured population, which has seen flatter suicide rates over the 2007 to 2016 period.
- Female suicide rates have been increasing in the general and insured population, however, it contributed little to the overall insured population trend which remains fairly flat.
- Male suicide rates are 4 times higher than female rates in the insured population. This is similar to the 3.5 times ratio in the general population.
- Insured and general population suicide rates have a similar pattern by age, but US insured rates have a steeper increase by age.
- U.S. population suicide rates are 2.3 times higher than the insured population from 2007 to 2016.
- In 2016, U.S. insured and population standardized suicide rates were higher than their Canadian neighbors by 54 and 30 percent, respectively.
- Selecting the county-level top 30 percent median household income segment of the U.S. population lowers suicide rates by 13 percent, but population suicide rates were still 104 percent higher than insured suicide rates from 2006-2016.
- Standardizing age and gender is important to effectively compare insured and general population suicide rates, as the insured population is significantly more concentrated in ages 30-59
and in males.
2. How do suicide rates vary in the insured portfolio?
- 28 percent of suicides happen in the second quarter, more than any other quarter.
- Male suicide rates increase with age while female rates increase then decrease after ages 45-54.
- Male suicides increase with policy duration while female rates are flatter.
- Age 50+ insured suicide rates increase with higher face amounts.
- In the first 10 durations, suicides are lower for permanent policies than for term. For term products, the suicide rate decreases as the level term period increases.
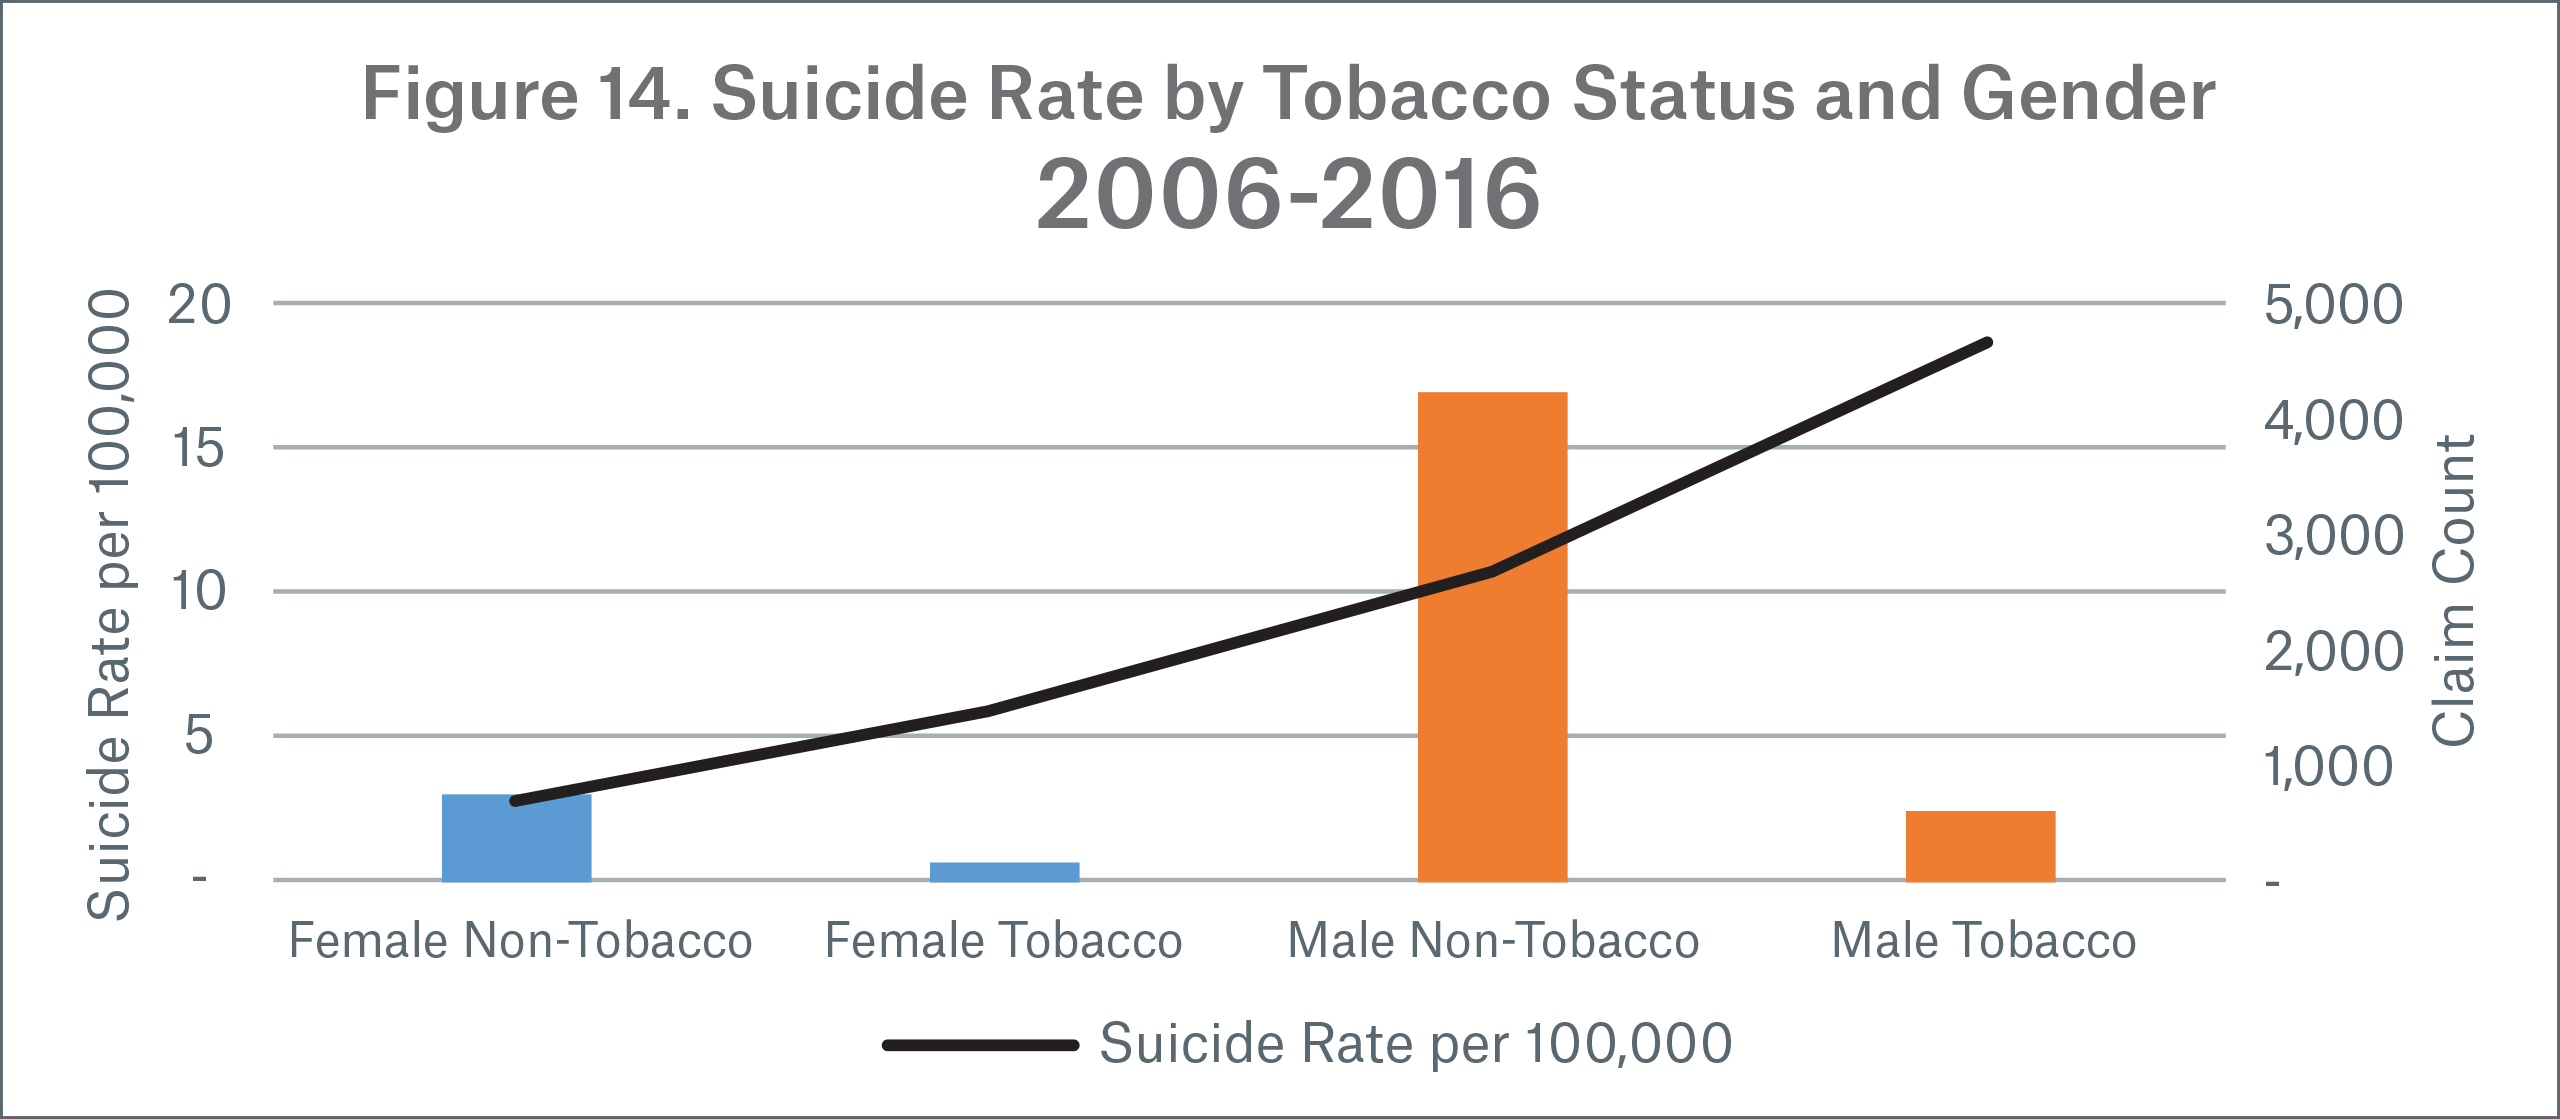
- Tobacco suicide rates are 2.4x higher than non-tobacco for females and 1.8x higher than non-tobacco for males.
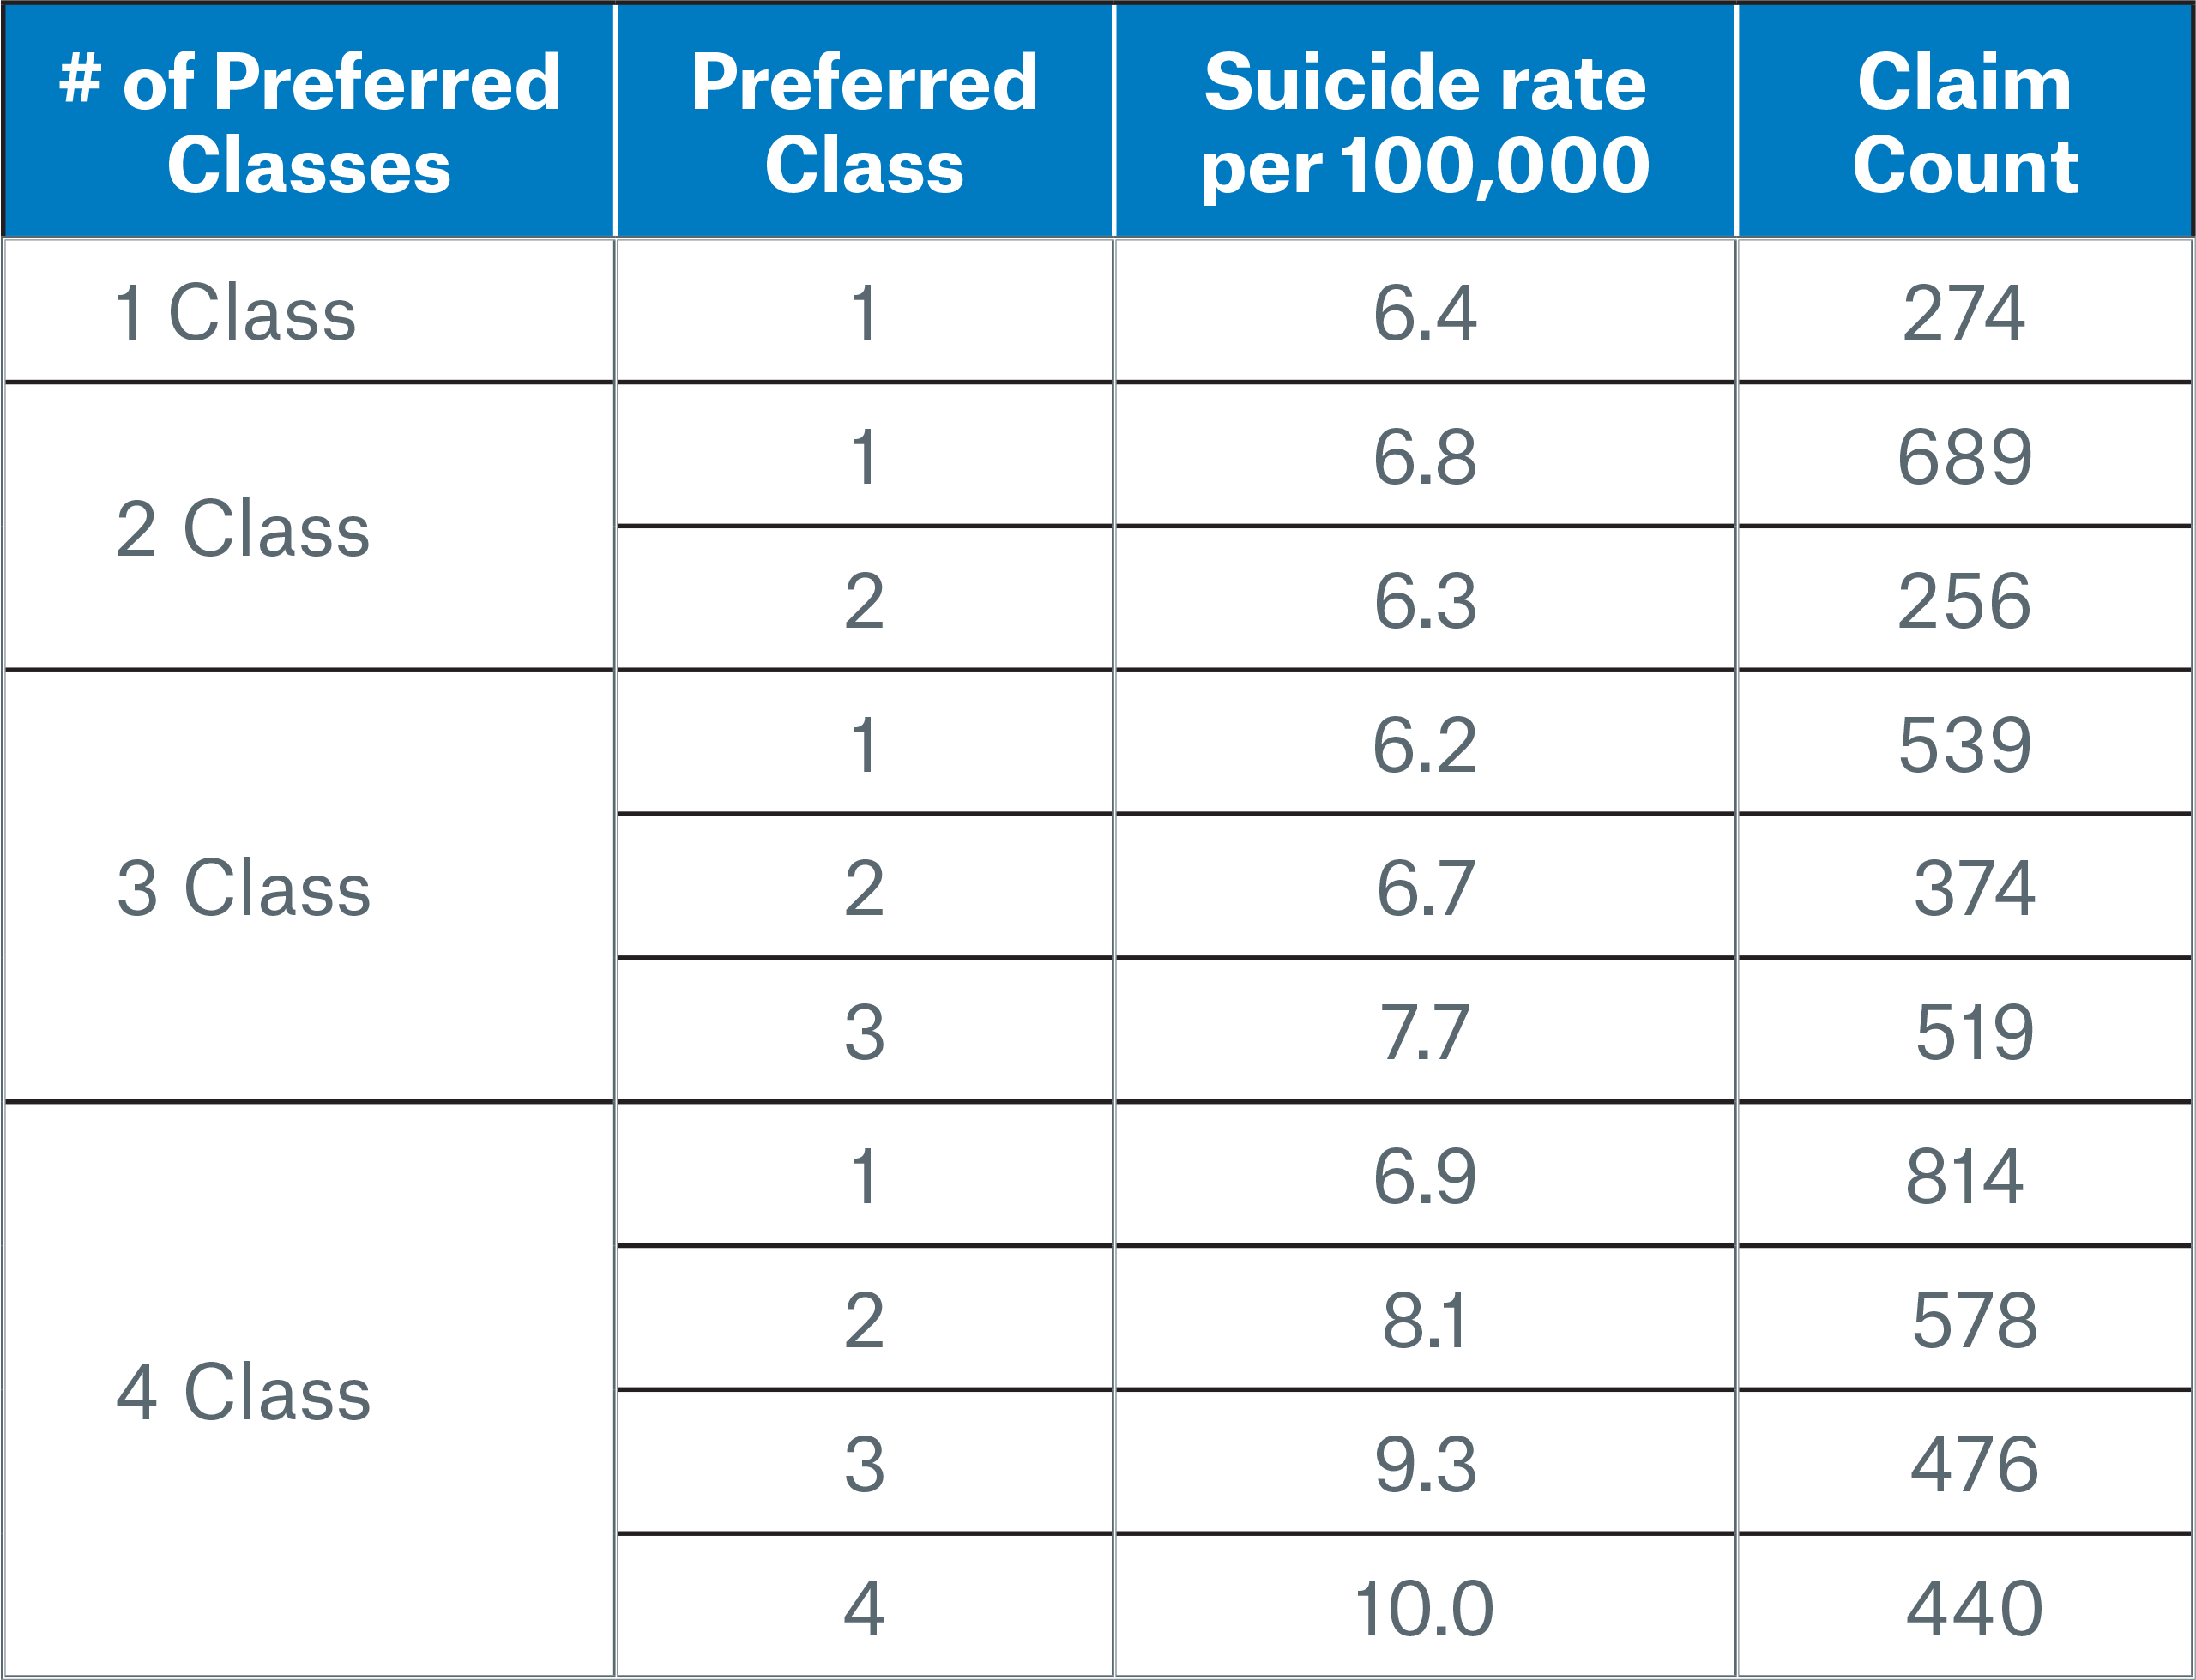
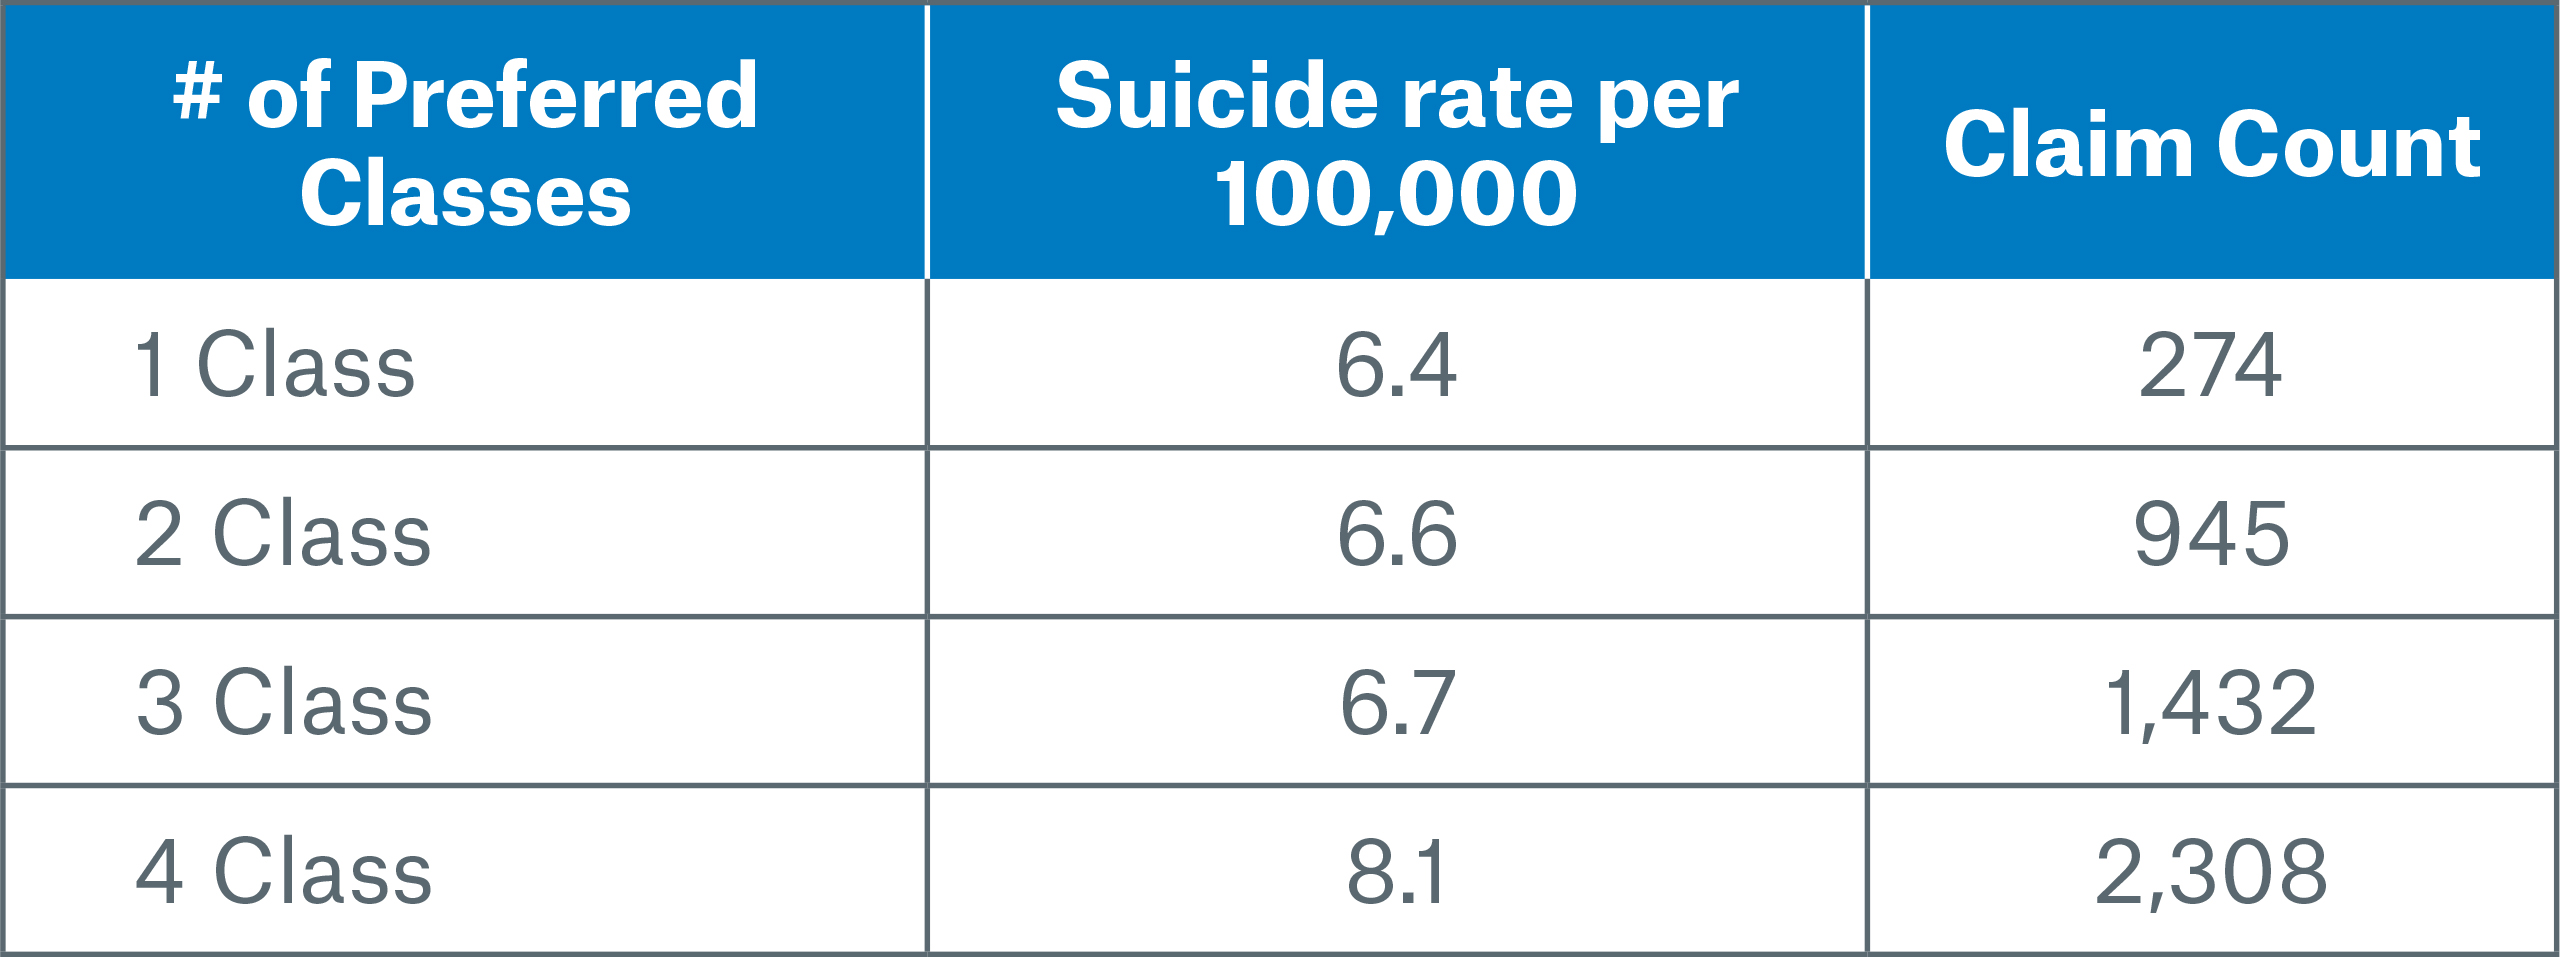
- Non-tobacco suicide rates (standardized by age and gender within each preferred class) are lower in the better preferred classes of 3- and 4-class systems. Although it is counterintuitive, the opposite is true for 2-class preferred systems, where suicide rates are worse in the best class than they are in the residual class.
Data sources
Insured population: Our data encompassed Munich Re’s internal U.S. and Canadian experience studies on reinsured lives covering the calendar year periods 2006-2016 (U.S.) and 2007-2016 (Canada).
In order to focus on the core business, we included only the following data: single life policies, new business issues (i.e. no conversions or exchanges), issue ages <90, automatically ceded business, known smoking status. In addition, we excluded term insurance that was in the post-level period after the premium jump.
General population data: Suicide death and population data was obtained from the CDC1 and from Statistics Canada.4 County level median income was obtained from the CDC. Codes used to identify suicides were “intentional self-harm (suicide) (*U03,X60-X84,Y87.0)” under ICD-10 (International Classification of Diseases version 10).
Standardization
All suicide rates in the first section below have been standardized by age and gender to Munich Re’s 2016 insured population, which has more males and more people age 30-59 than in the general population. See Appendix – Standardization for more details and an example.
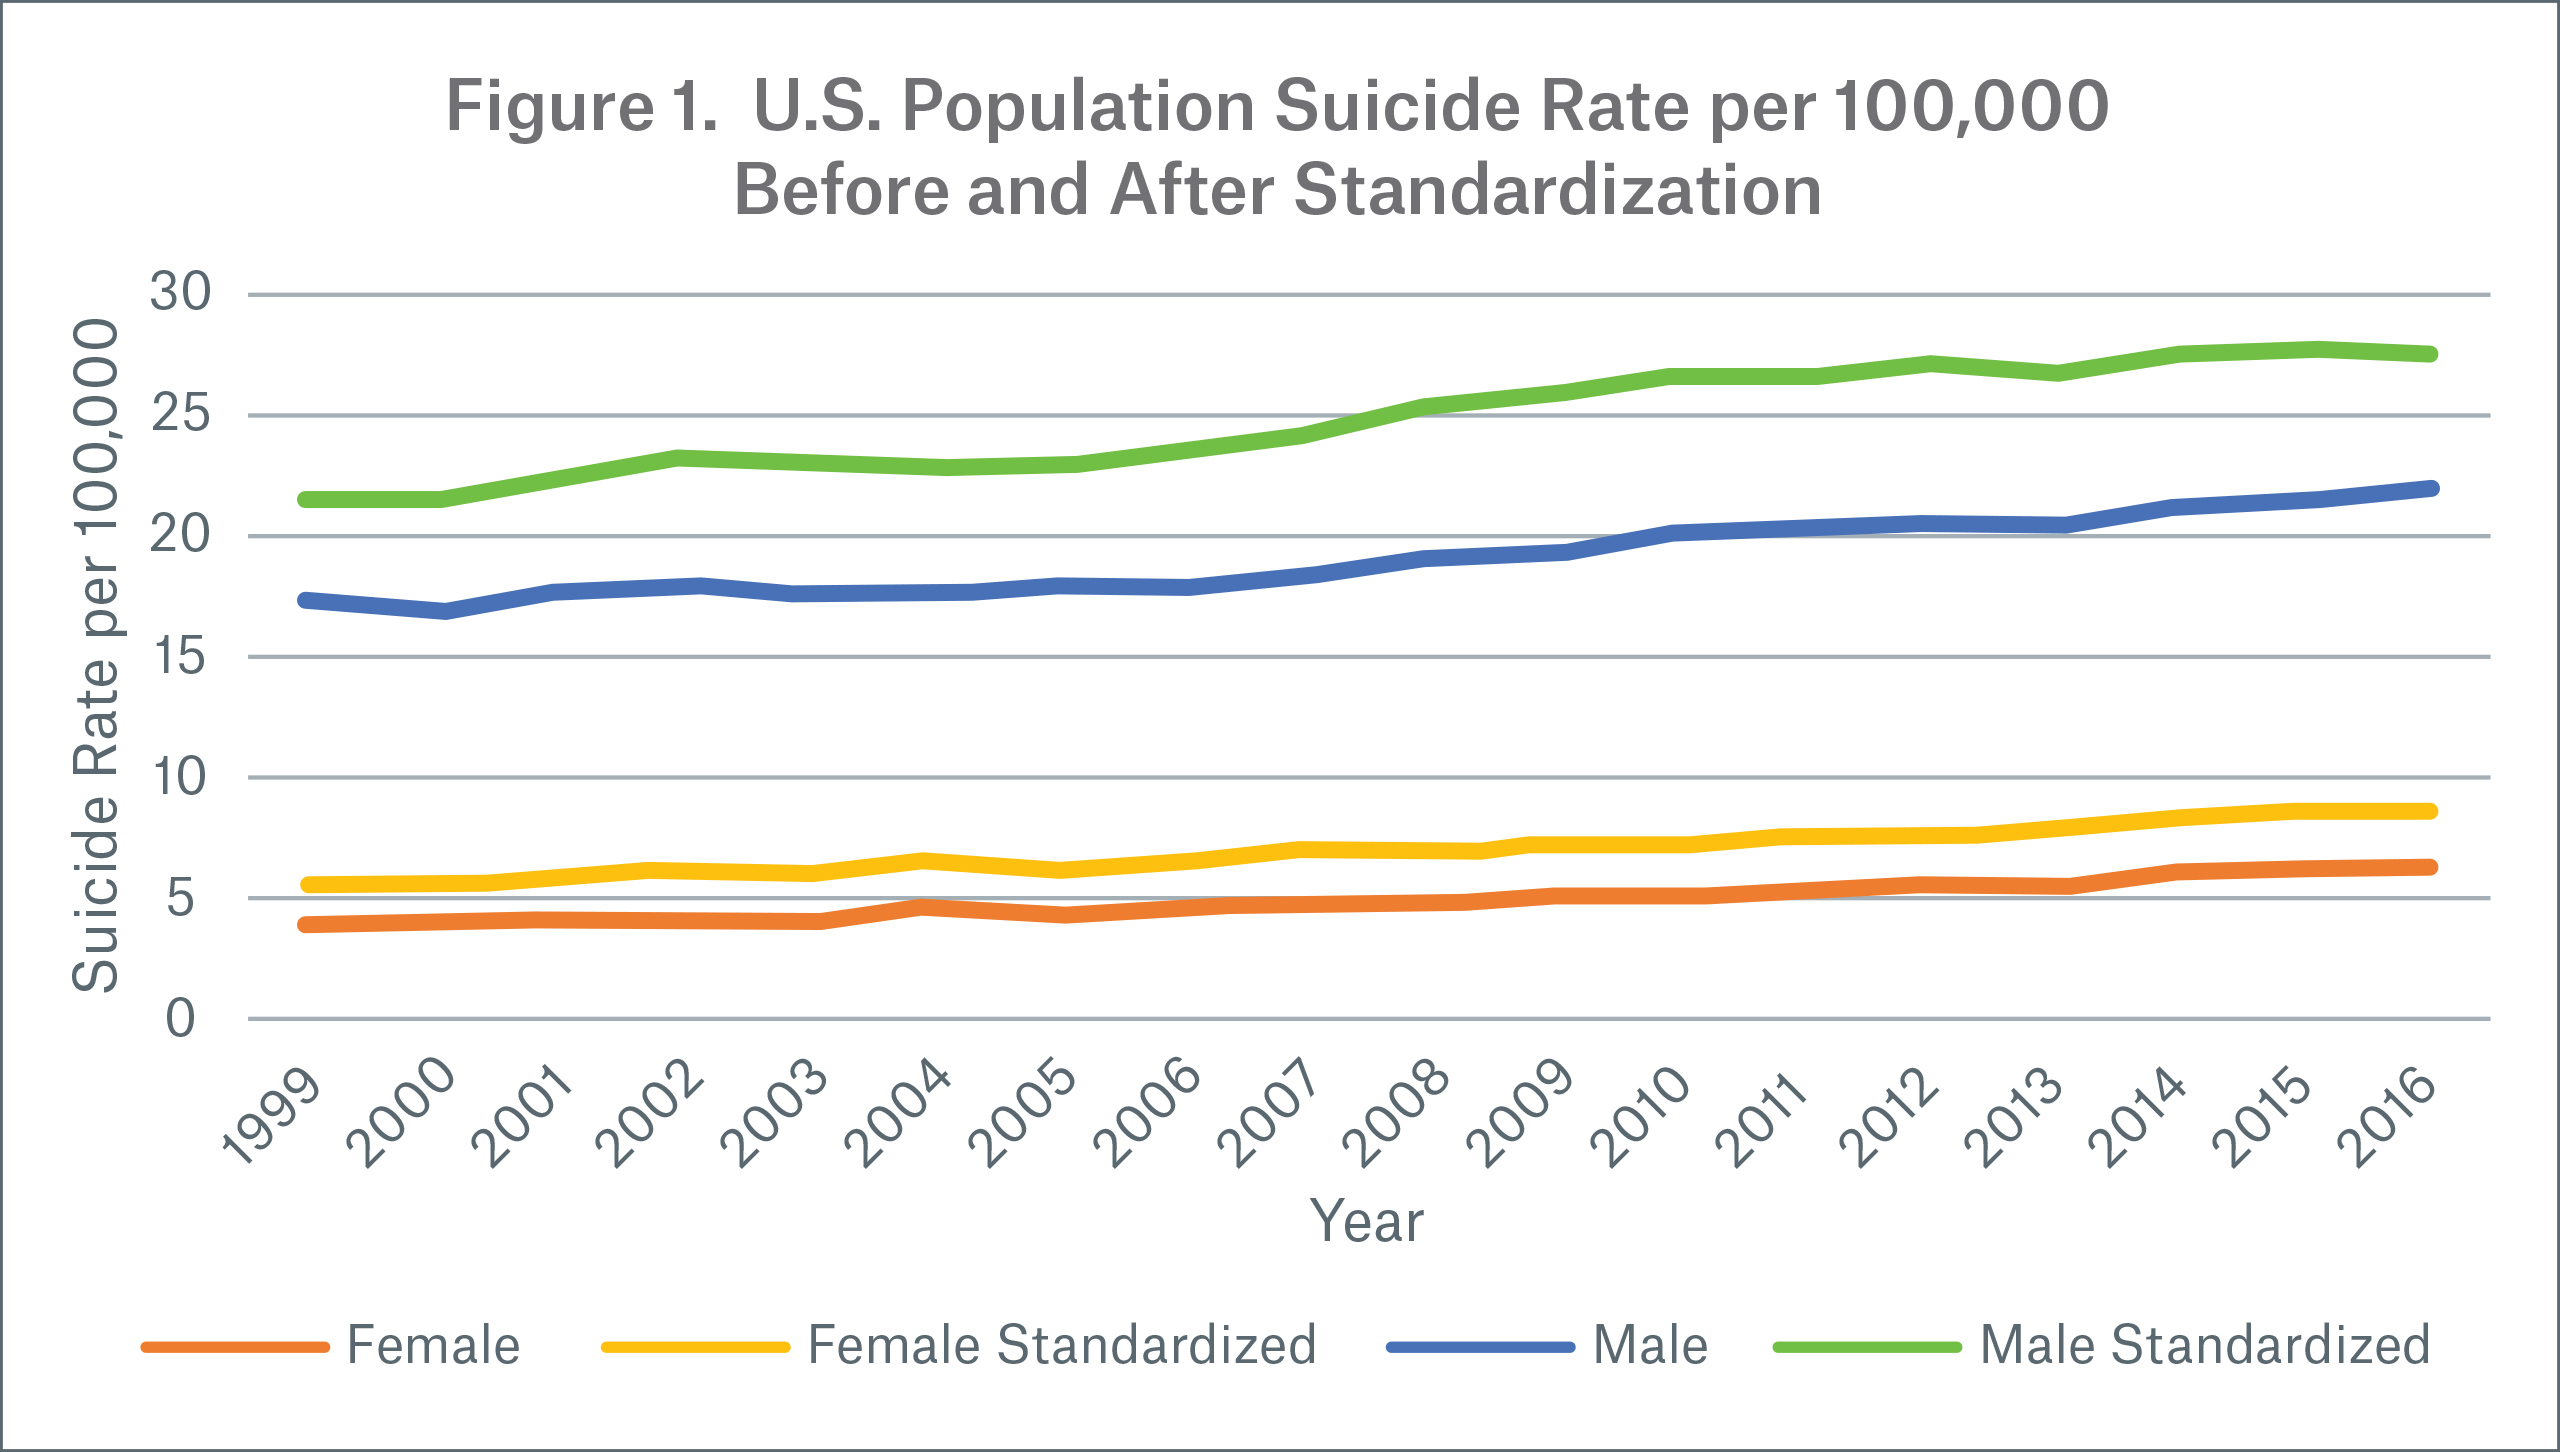
Figure 1 shows a comparison of U.S. population suicide rates per 100,000 before and after standardization.
Note:
- Standardization significantly increased population suicide rates as weight shifted from ages less than 30 to ages 30-59, which have higher suicide rates.
- Overall, female suicide rates are 1.4x higher and male suicide rates are 1.3x higher after standardization.
- After standardization, both genders still show a worsening trend over time.
How do general population suicide trends translate into insured experience?
In this section we share observations derived from comparing year, age, gender and income for U.S. and Canadian suicide rates in the general population with those observed in Munich Re’s insured dataset. All rates have been standardized by age and gender to make the comparisons clearer. Unless otherwise noted, suicides rates are shown for the 2007 to 2016 period.
Suicide rates by year:
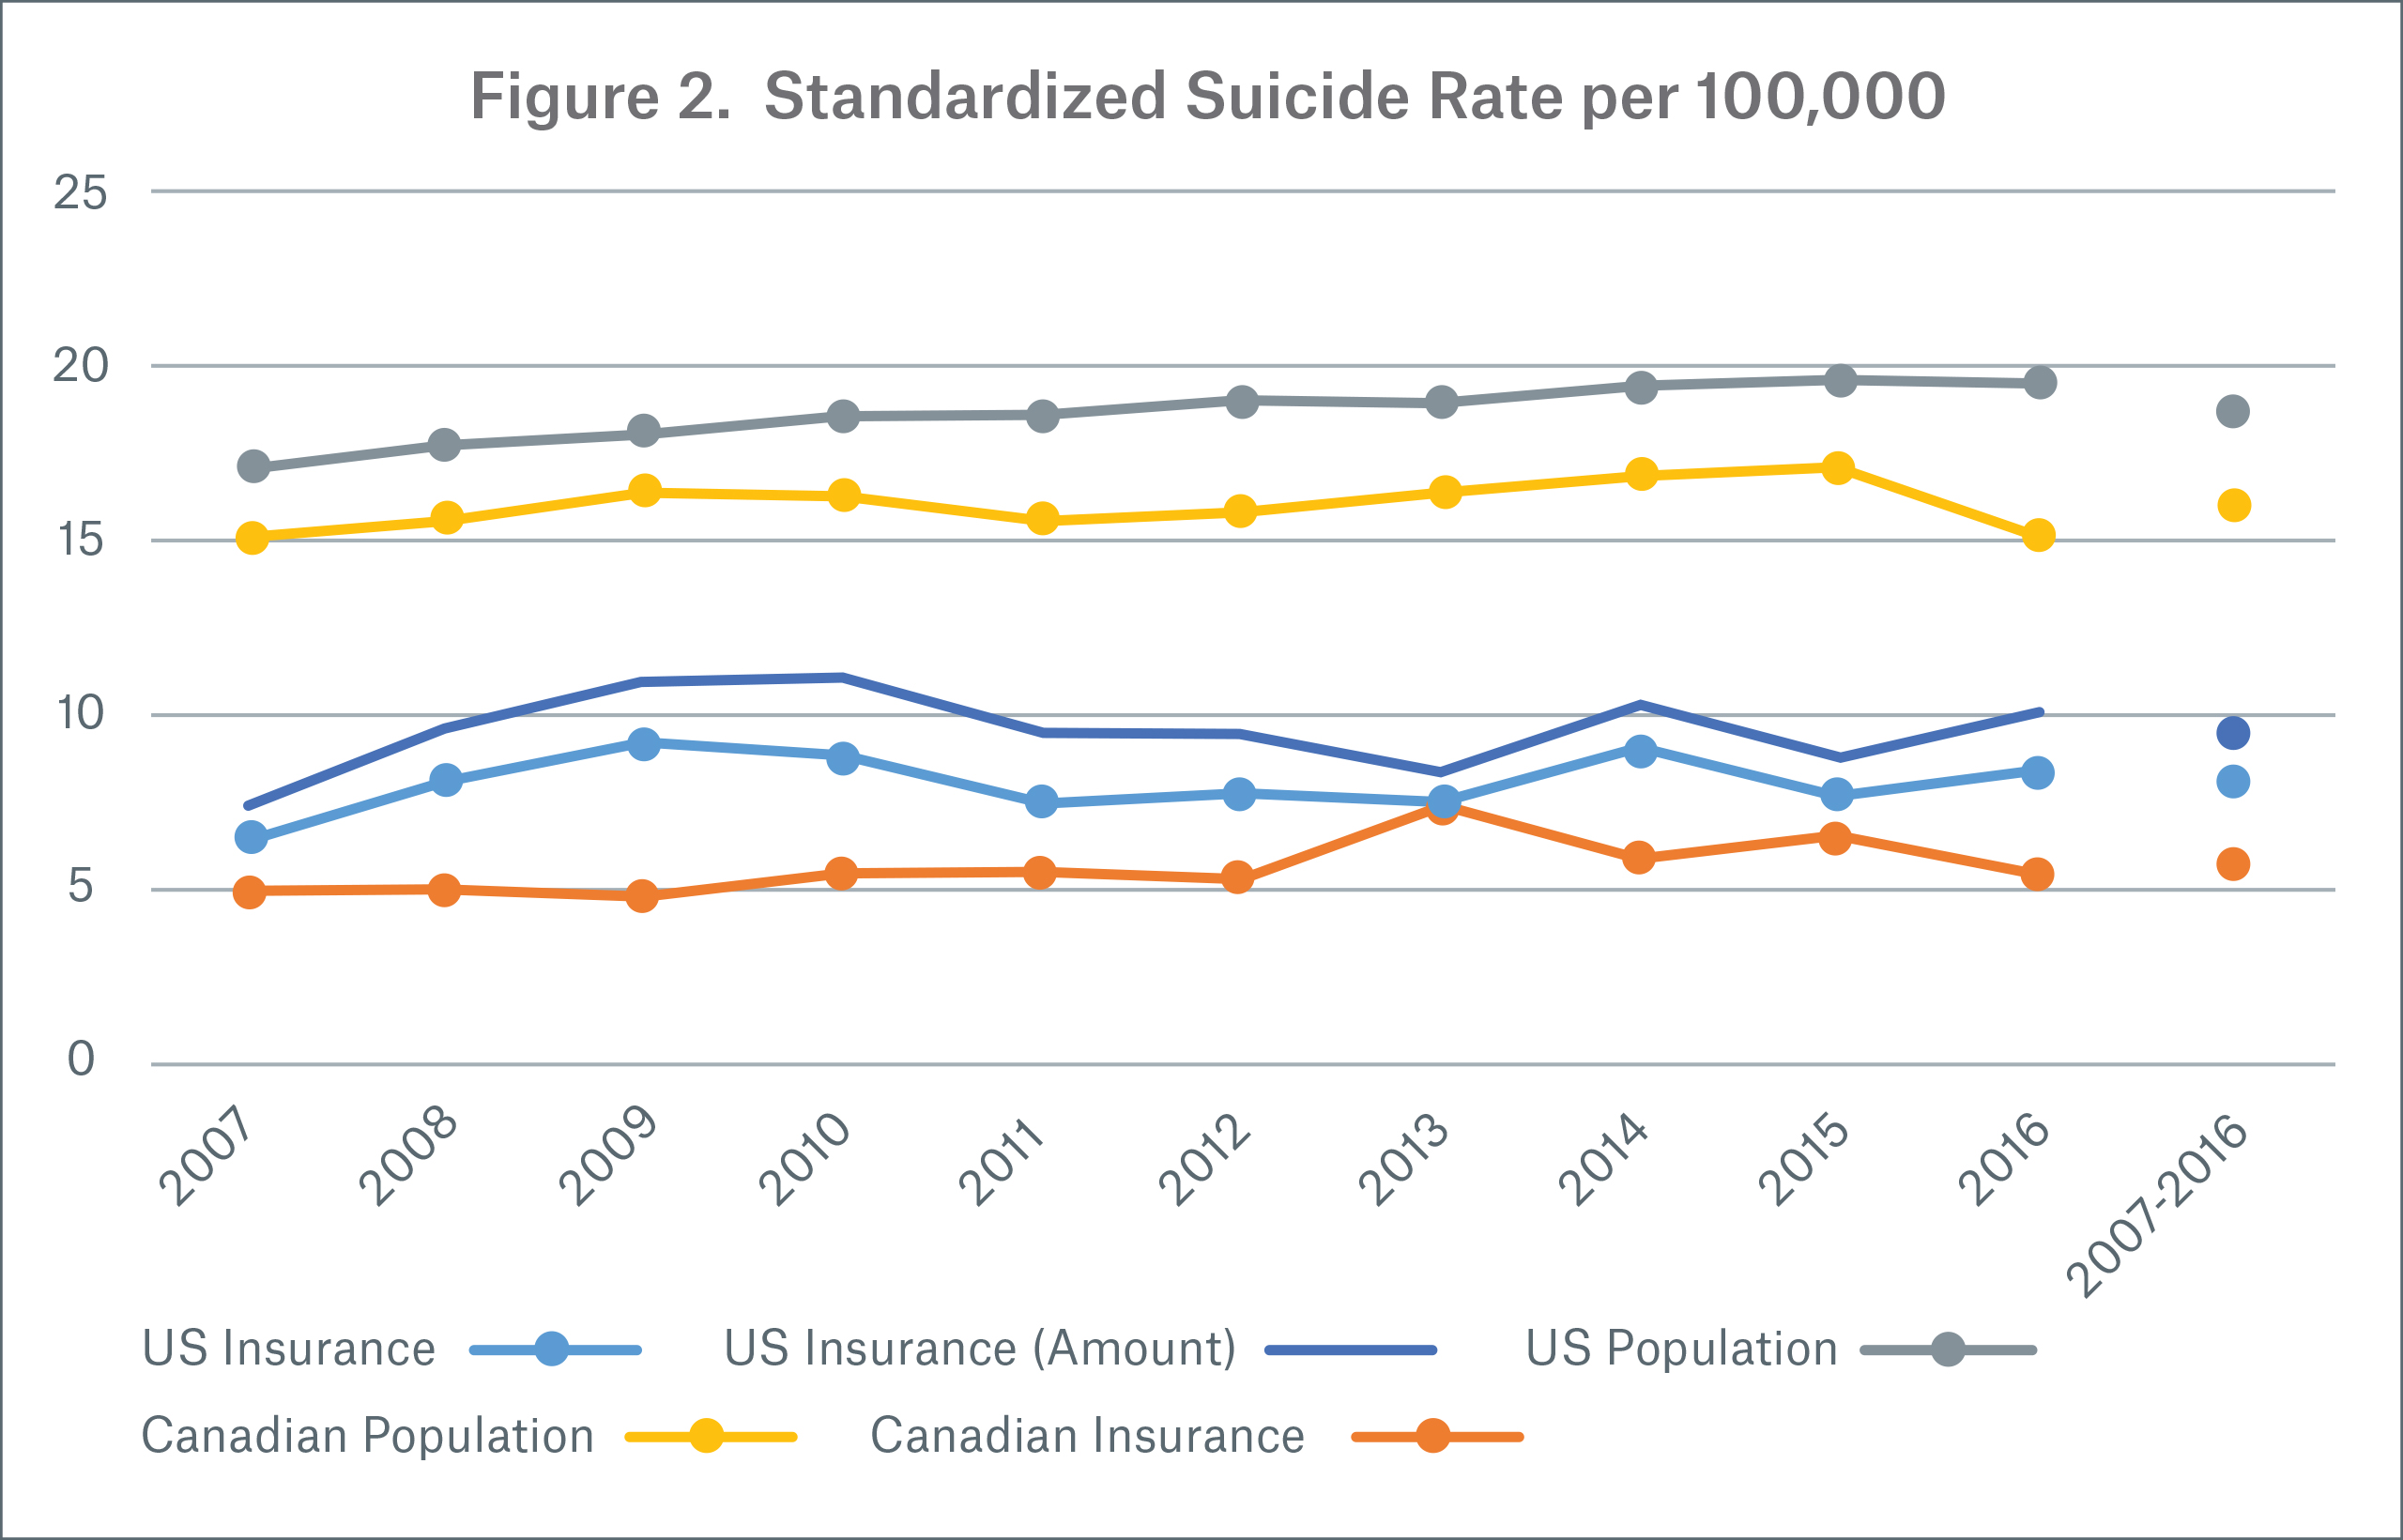
Figure 2 shows suicide rates by count, except for the U.S. insured population, where we also show rates by face amount.
Looking at the U.S., the consistent increasing trend observed in the general population has not translated into the insured population. Over the 2007-2016 period, U.S. insured suicide rates by face amount follow a pattern similar to insured suicide rates by count, but are 17 percent higher; this indicates higher policy face amounts have higher suicide rates. In Canada, population suicide rates have crept up since 2007 but dropped in 2016. Overall, U.S. insured suicide rates were 43 percent higher than the Canadian insured population rates, while the U.S. population suicide rates were 17 percent higher than Canadian population rates.
The increases in 2009 and 2010 are likely linked to the financial crisis and are mostly driven by males aged 35-64, although female suicides increased during these years as well. During, and for a few years after the financial crisis, insured suicide rates by face amount increased more than suicide rates by count. This effect is specific to the U.S. insured population as it does not appear in the U.S. population.
Comparing insured lives to the general population from 2007 to 2016, standardized suicide rates in the U.S. general population are 2.3x higher than the insured population and 2.8x higher in the Canadian general population than the insured population.
Suicide rates by gender and year:
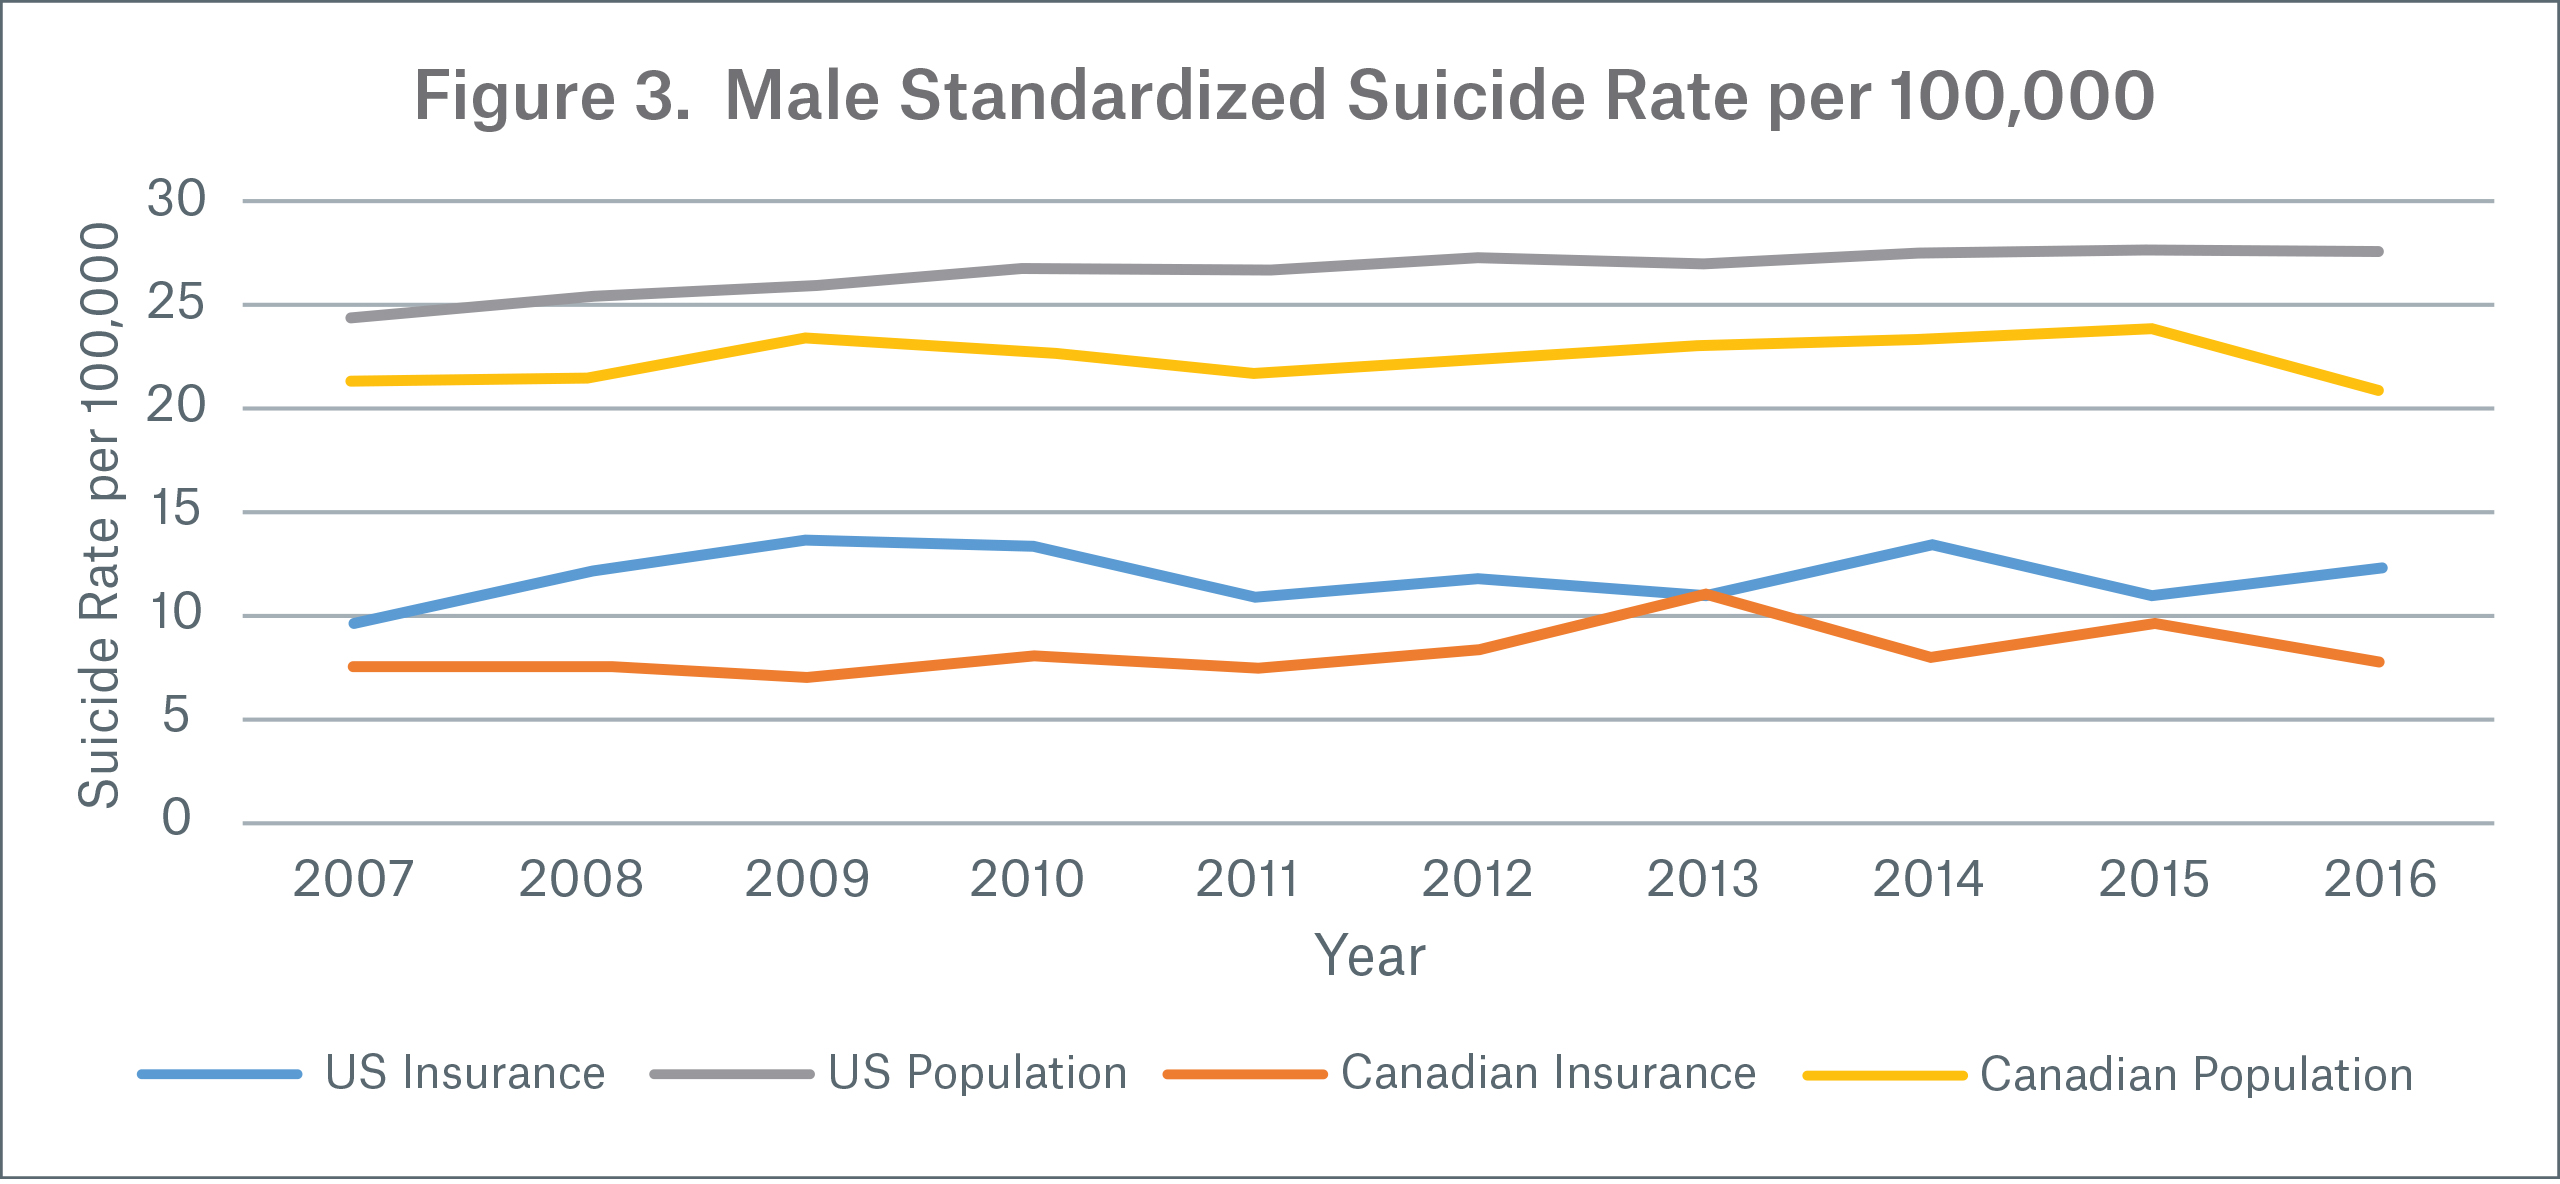
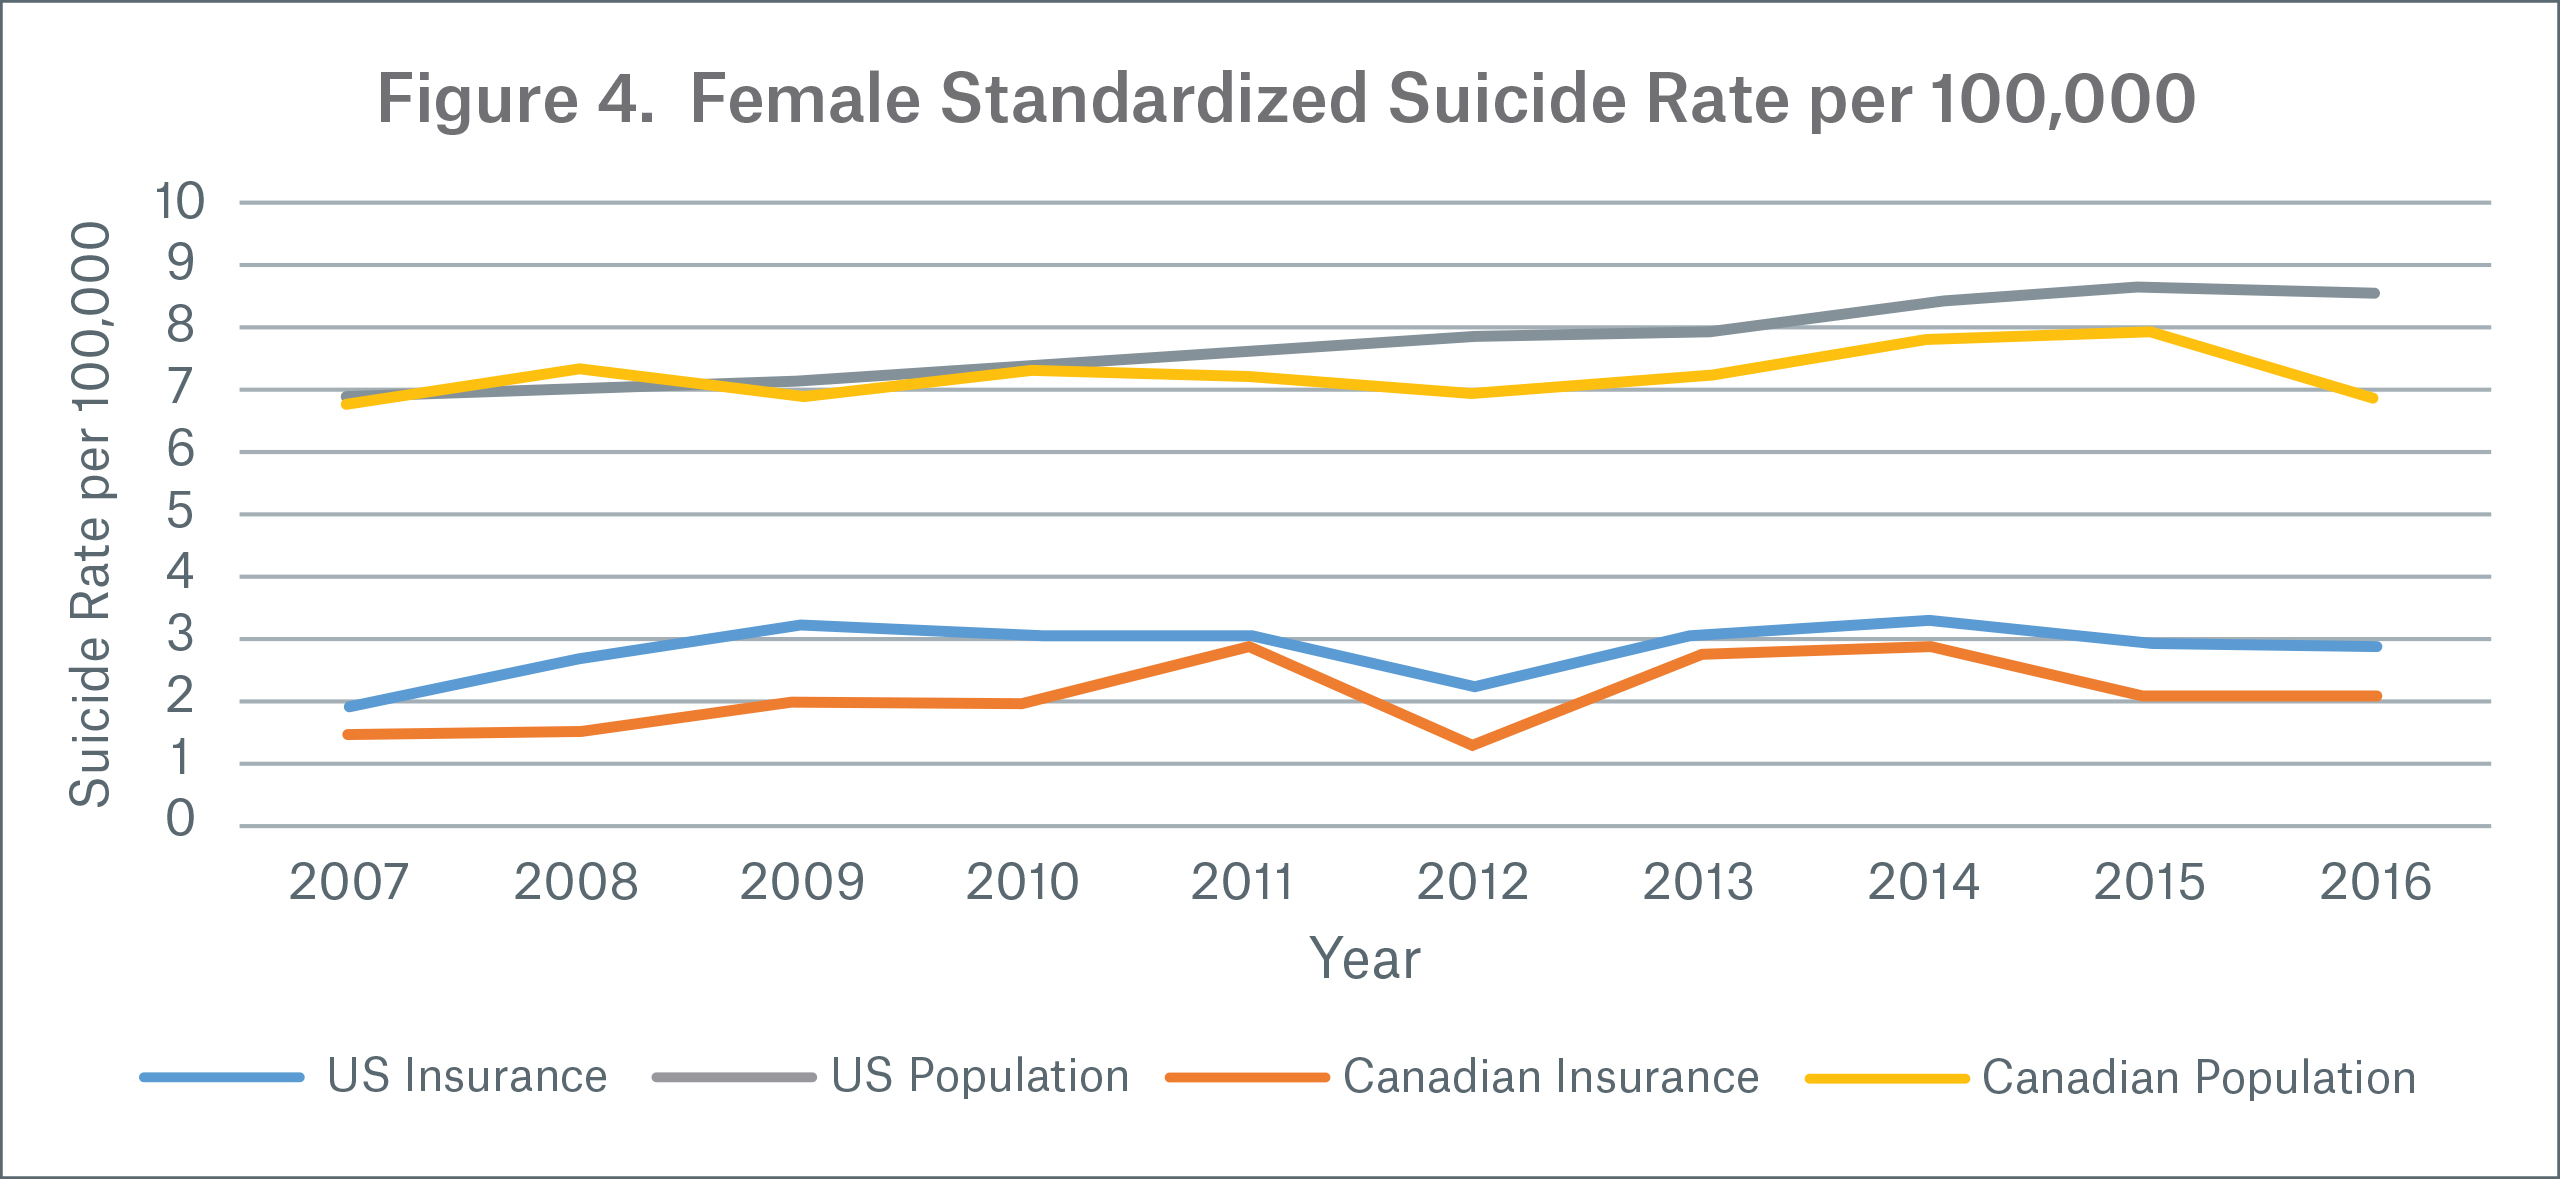
Male insured suicide rates (Figure 3) do not show a definite trend but have exhibited some volatility throughout the 2007 to 2016 period. In all populations except the Canadian general population, female suicide rates have significantly increased over the same period. (Figure 4) Although female suicides have increased in the U.S. insured population, their effect on the combined suicide rate is dampened when males are added, as male suicide rates are 4x higher in the insured population (from 2007 to 2016). In the general population, male suicide rates are 3.5x higher than female rates over the same time period.
Suicide rates by age group:
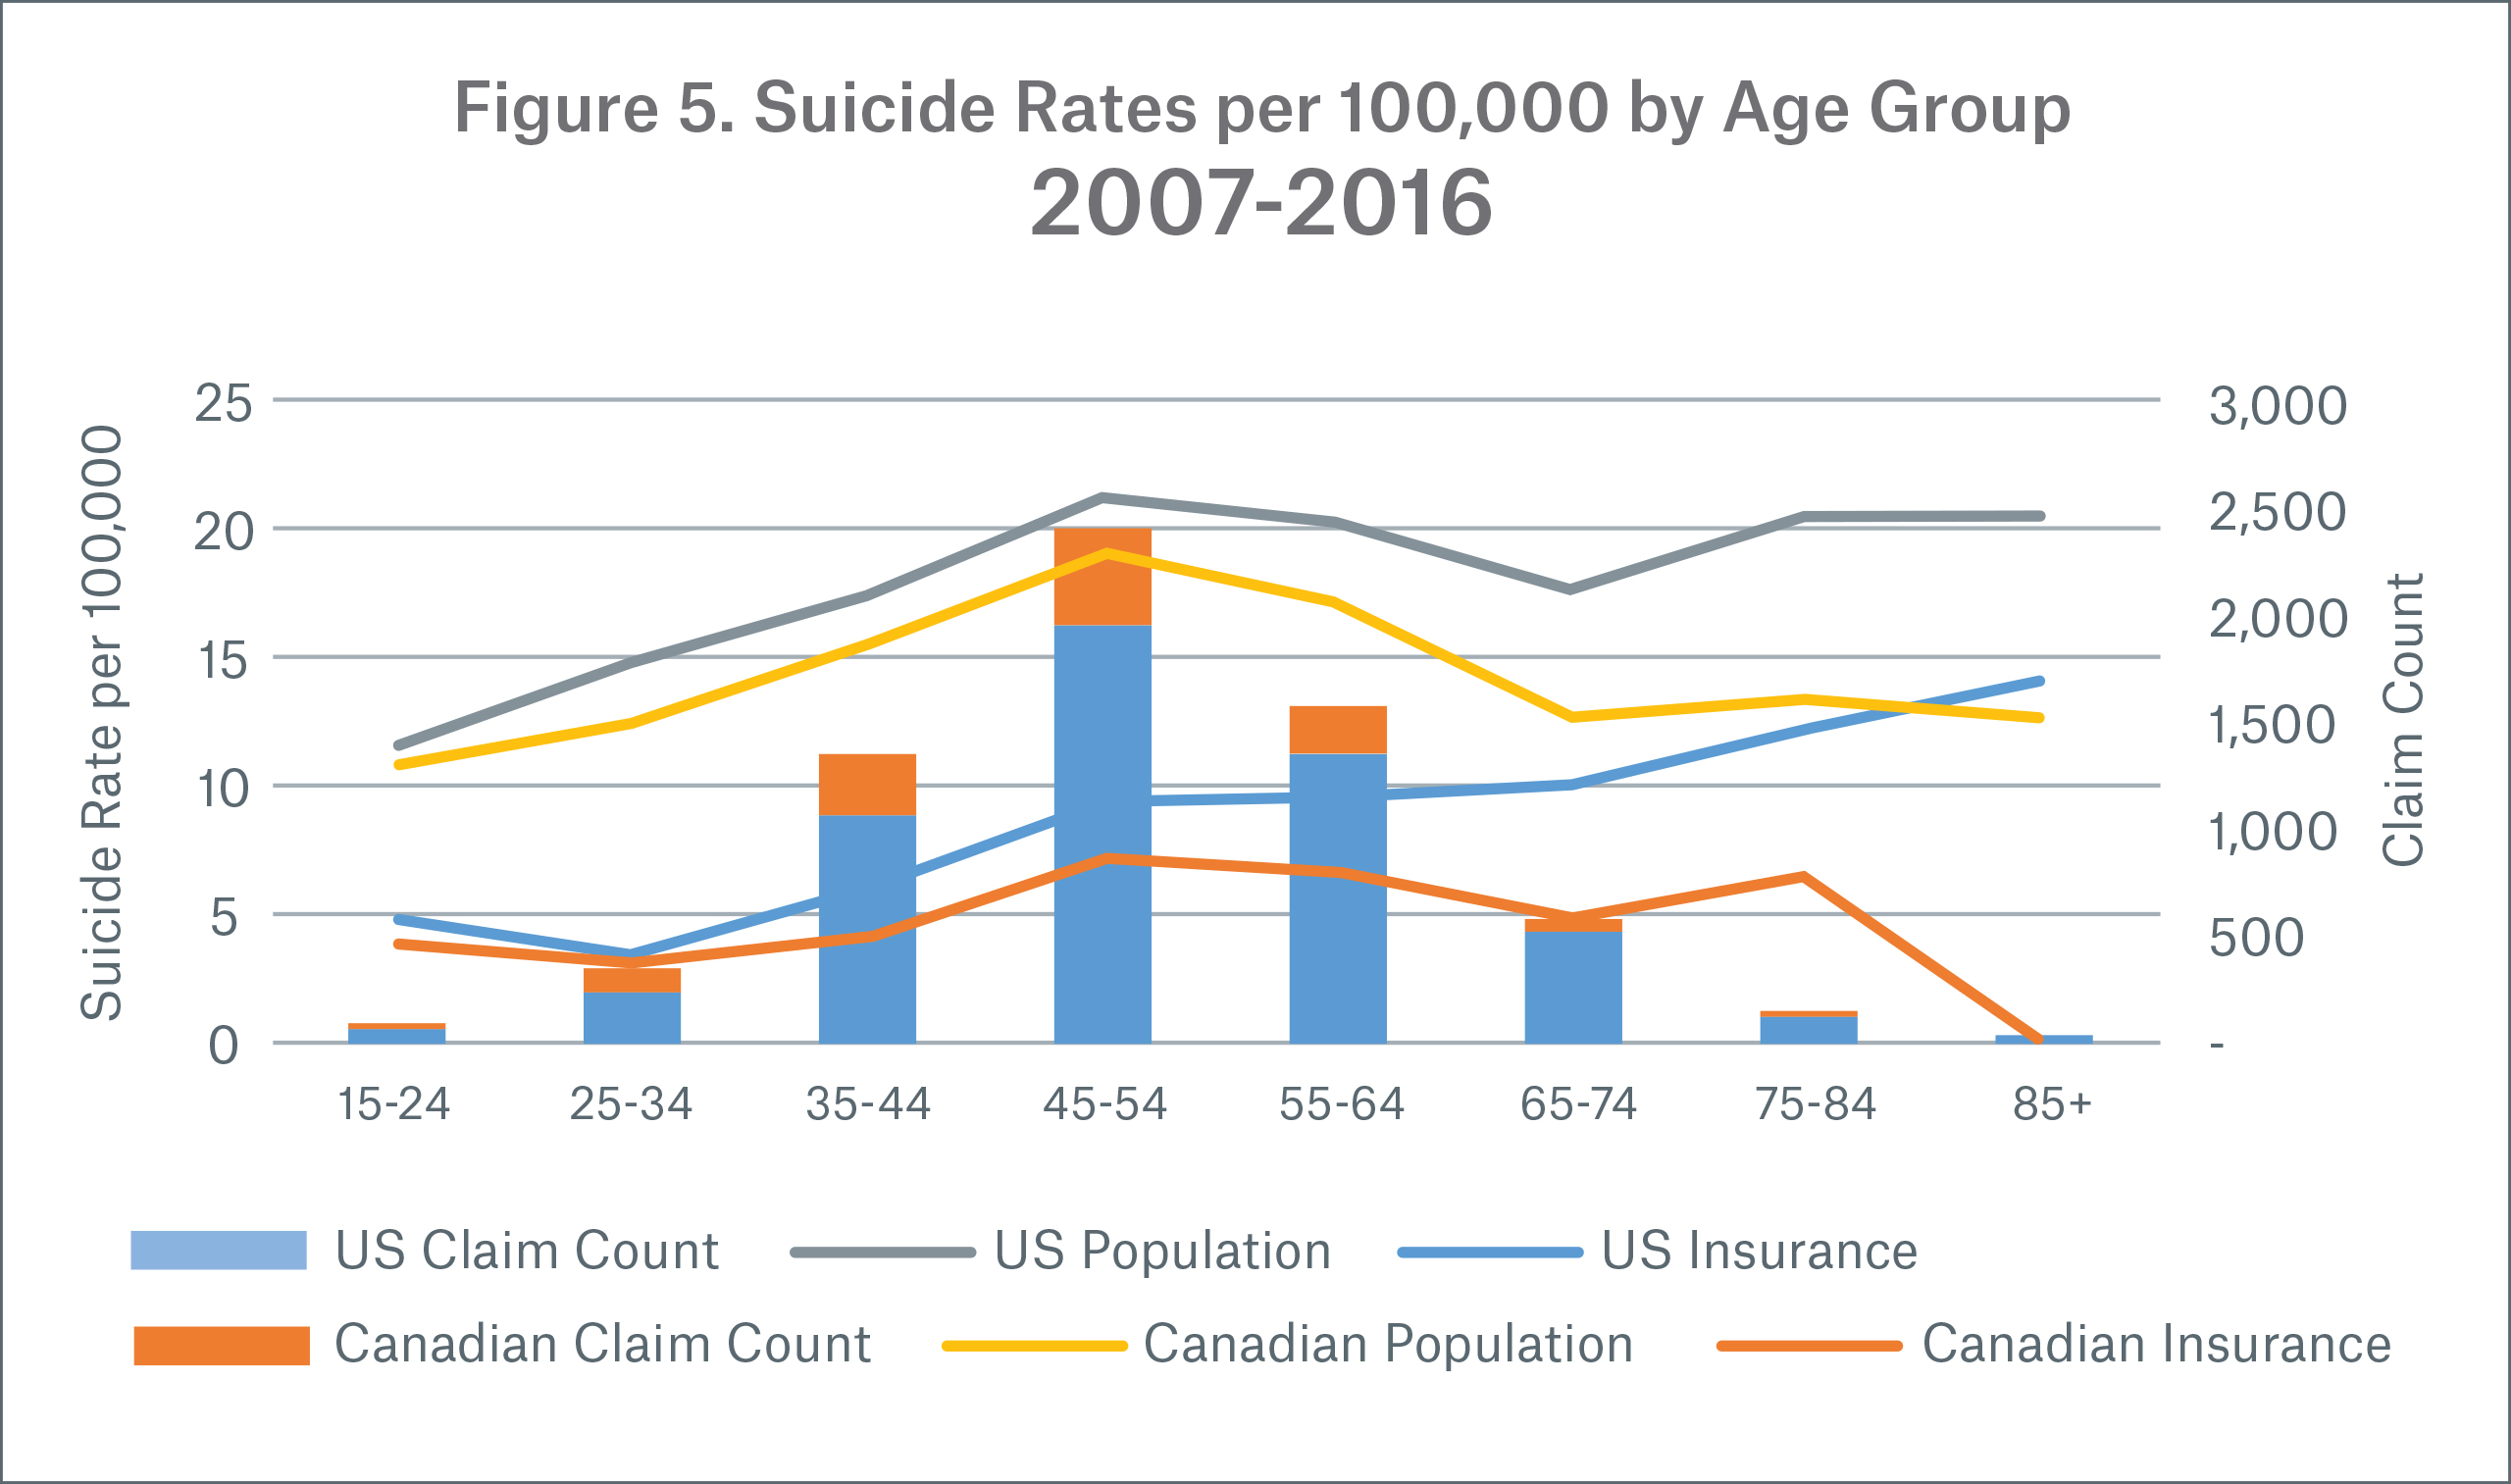
In Figure 5, suicide rates are represented as lines while insured claims are shown as stacked columns; note that claims are low for the younger and older age groups. Suicides for ages below 15 were removed.
Canadian insured and both general populations suicide rates have a similar pattern by age group, showing a peak around ages 45-54 and again for ages 75+, although the age 75+ insured data is not yet credible. U.S. insured rates have a steeper slope up by age compared to the U.S. population. Both the U.S. and Canadian suicide rates have a similar pattern until ages 55+, where U.S. rates continue to increase while Canadian rates diverge downward.
Suicide rates for the general population in the top 30 percent of U.S. counties (based on the average county-level median household income):
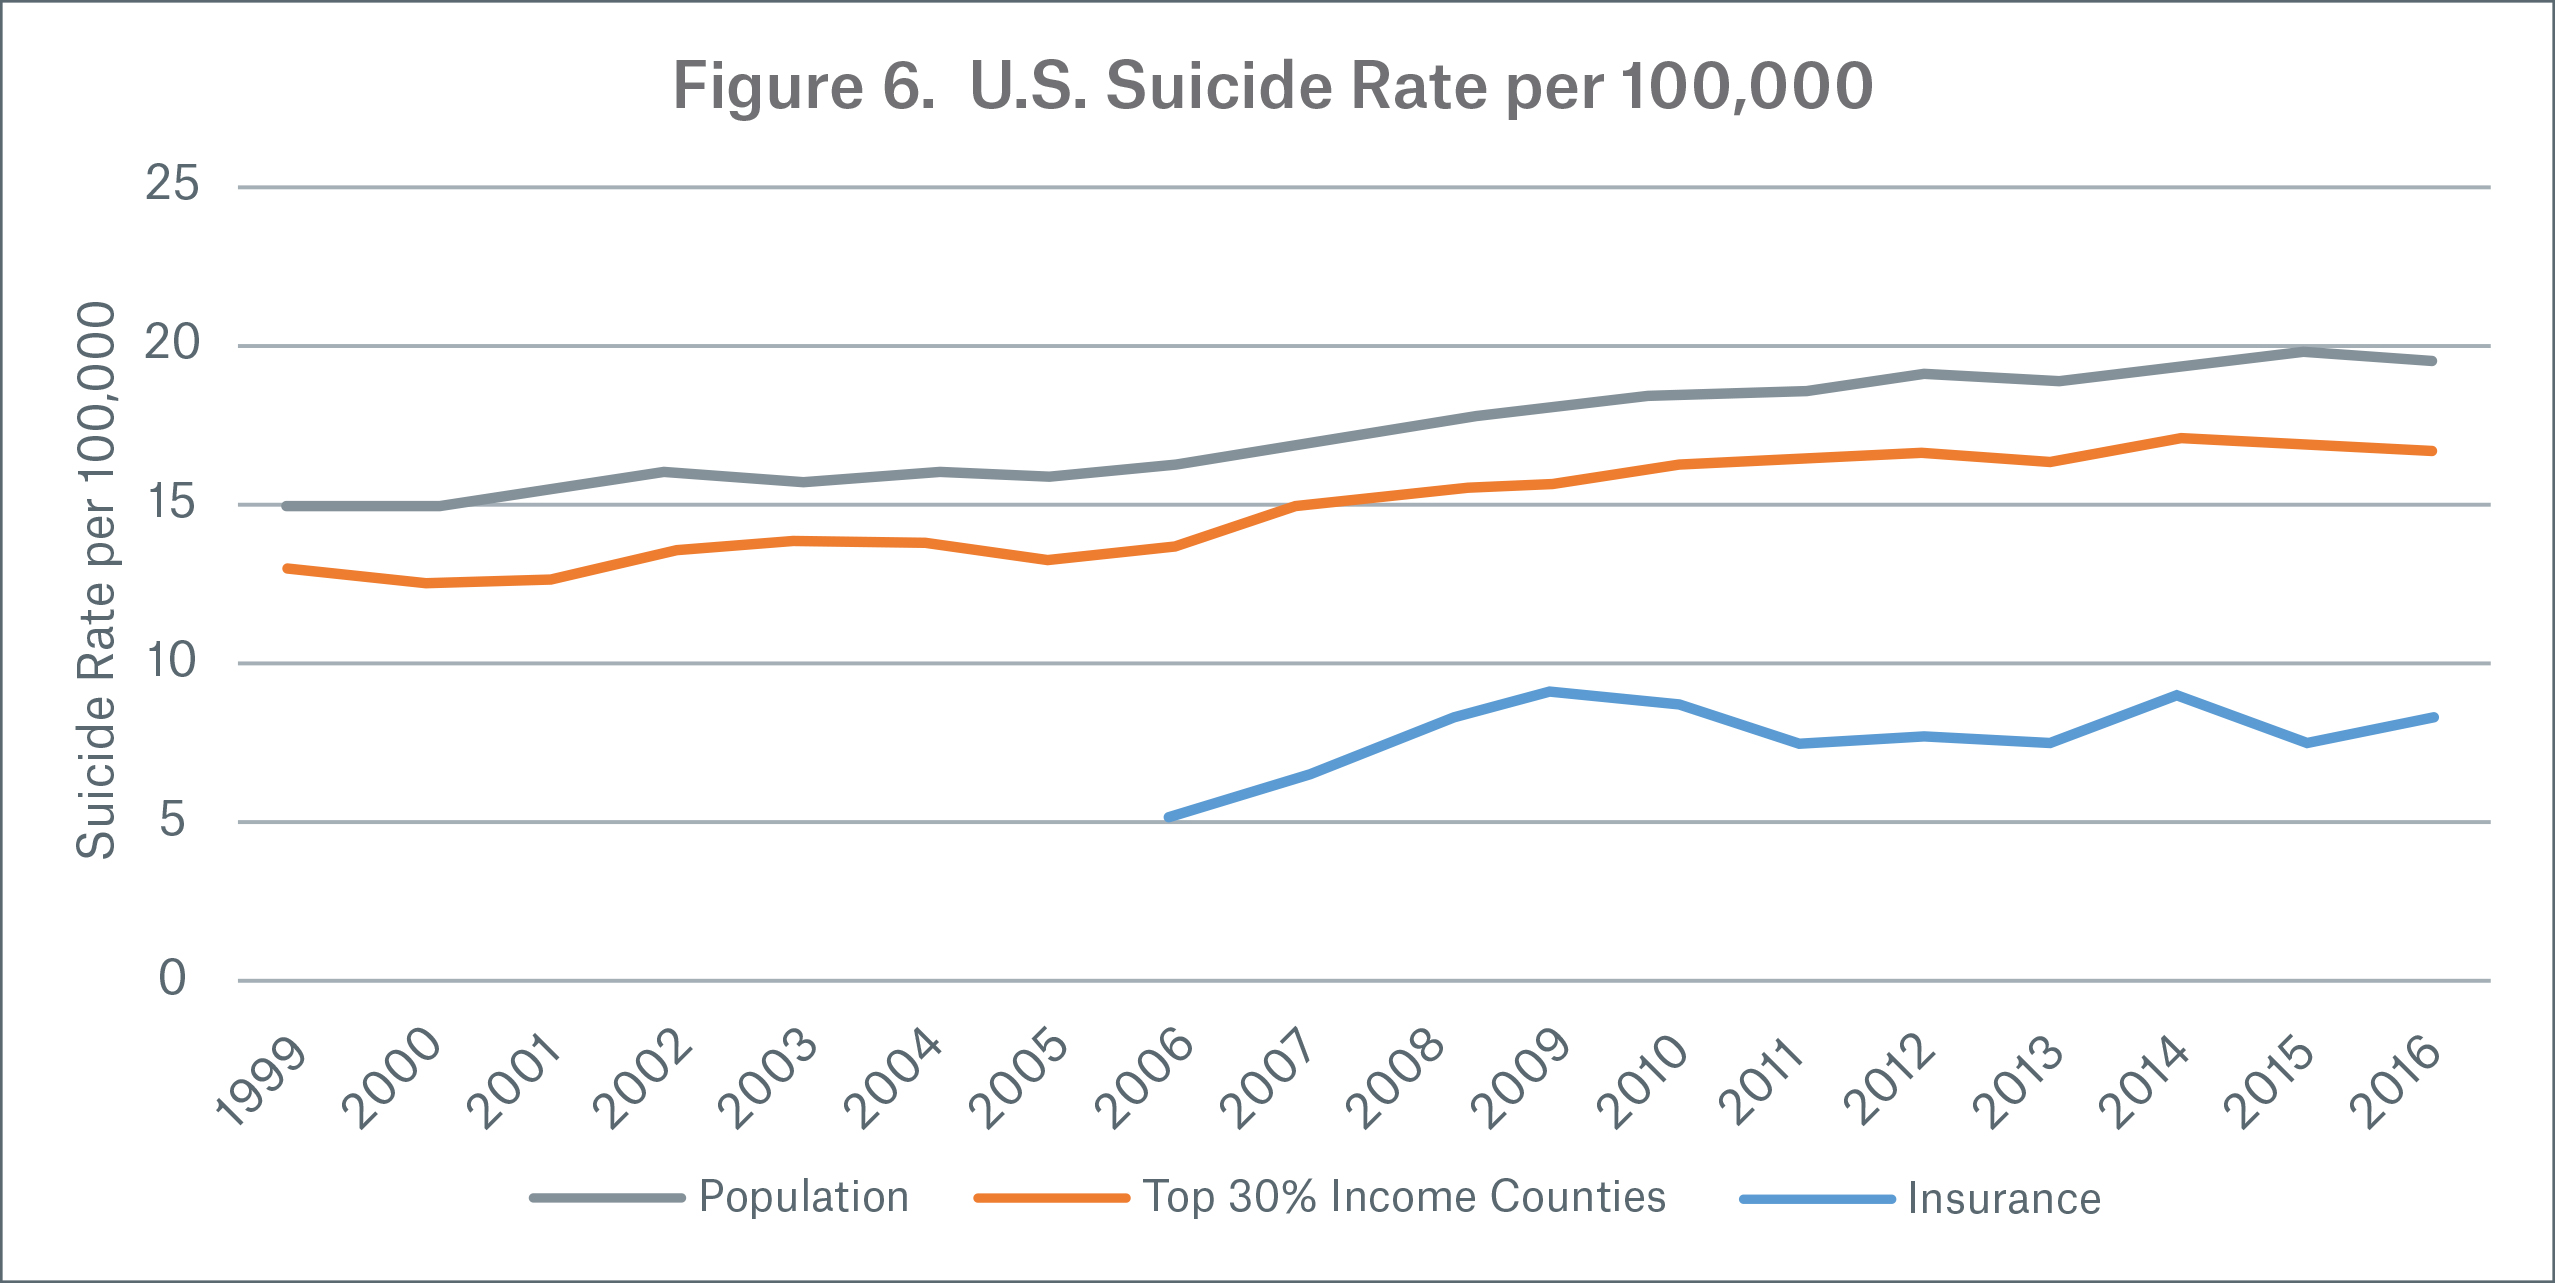
Suicide rates for the top 30 percent of counties by median household income are 13 percent lower than the general population but 104 percent higher than the insured population from 2006 to 2016. (Figure 6) This indicates that income may explain some of the gap between population and insured rates. However, suicide rates for the top 30 percent of counties by income show an increasing trend while insured rates are flat, indicating the gap is growing.
Suicide rates for the top 30 percent counties by income were selected to give an insured comparison to the figures in the Society of Actuaries report, “U.S. Population Mortality Observations – Updated with 2016 Experience.” 5
How do suicide rates vary in the insured portfolio?
In this section we focus on U.S. insured population suicide rates per 100,000 for calendar years 2006-2016. Suicide rates are determined on a claim count basis. As we focus only on Munich Re’s insured dataset in this section, the suicide rates are not standardized in subsequent figures except the first to show how similar rates are.
Standardized vs. non-standardized rates by year and gender
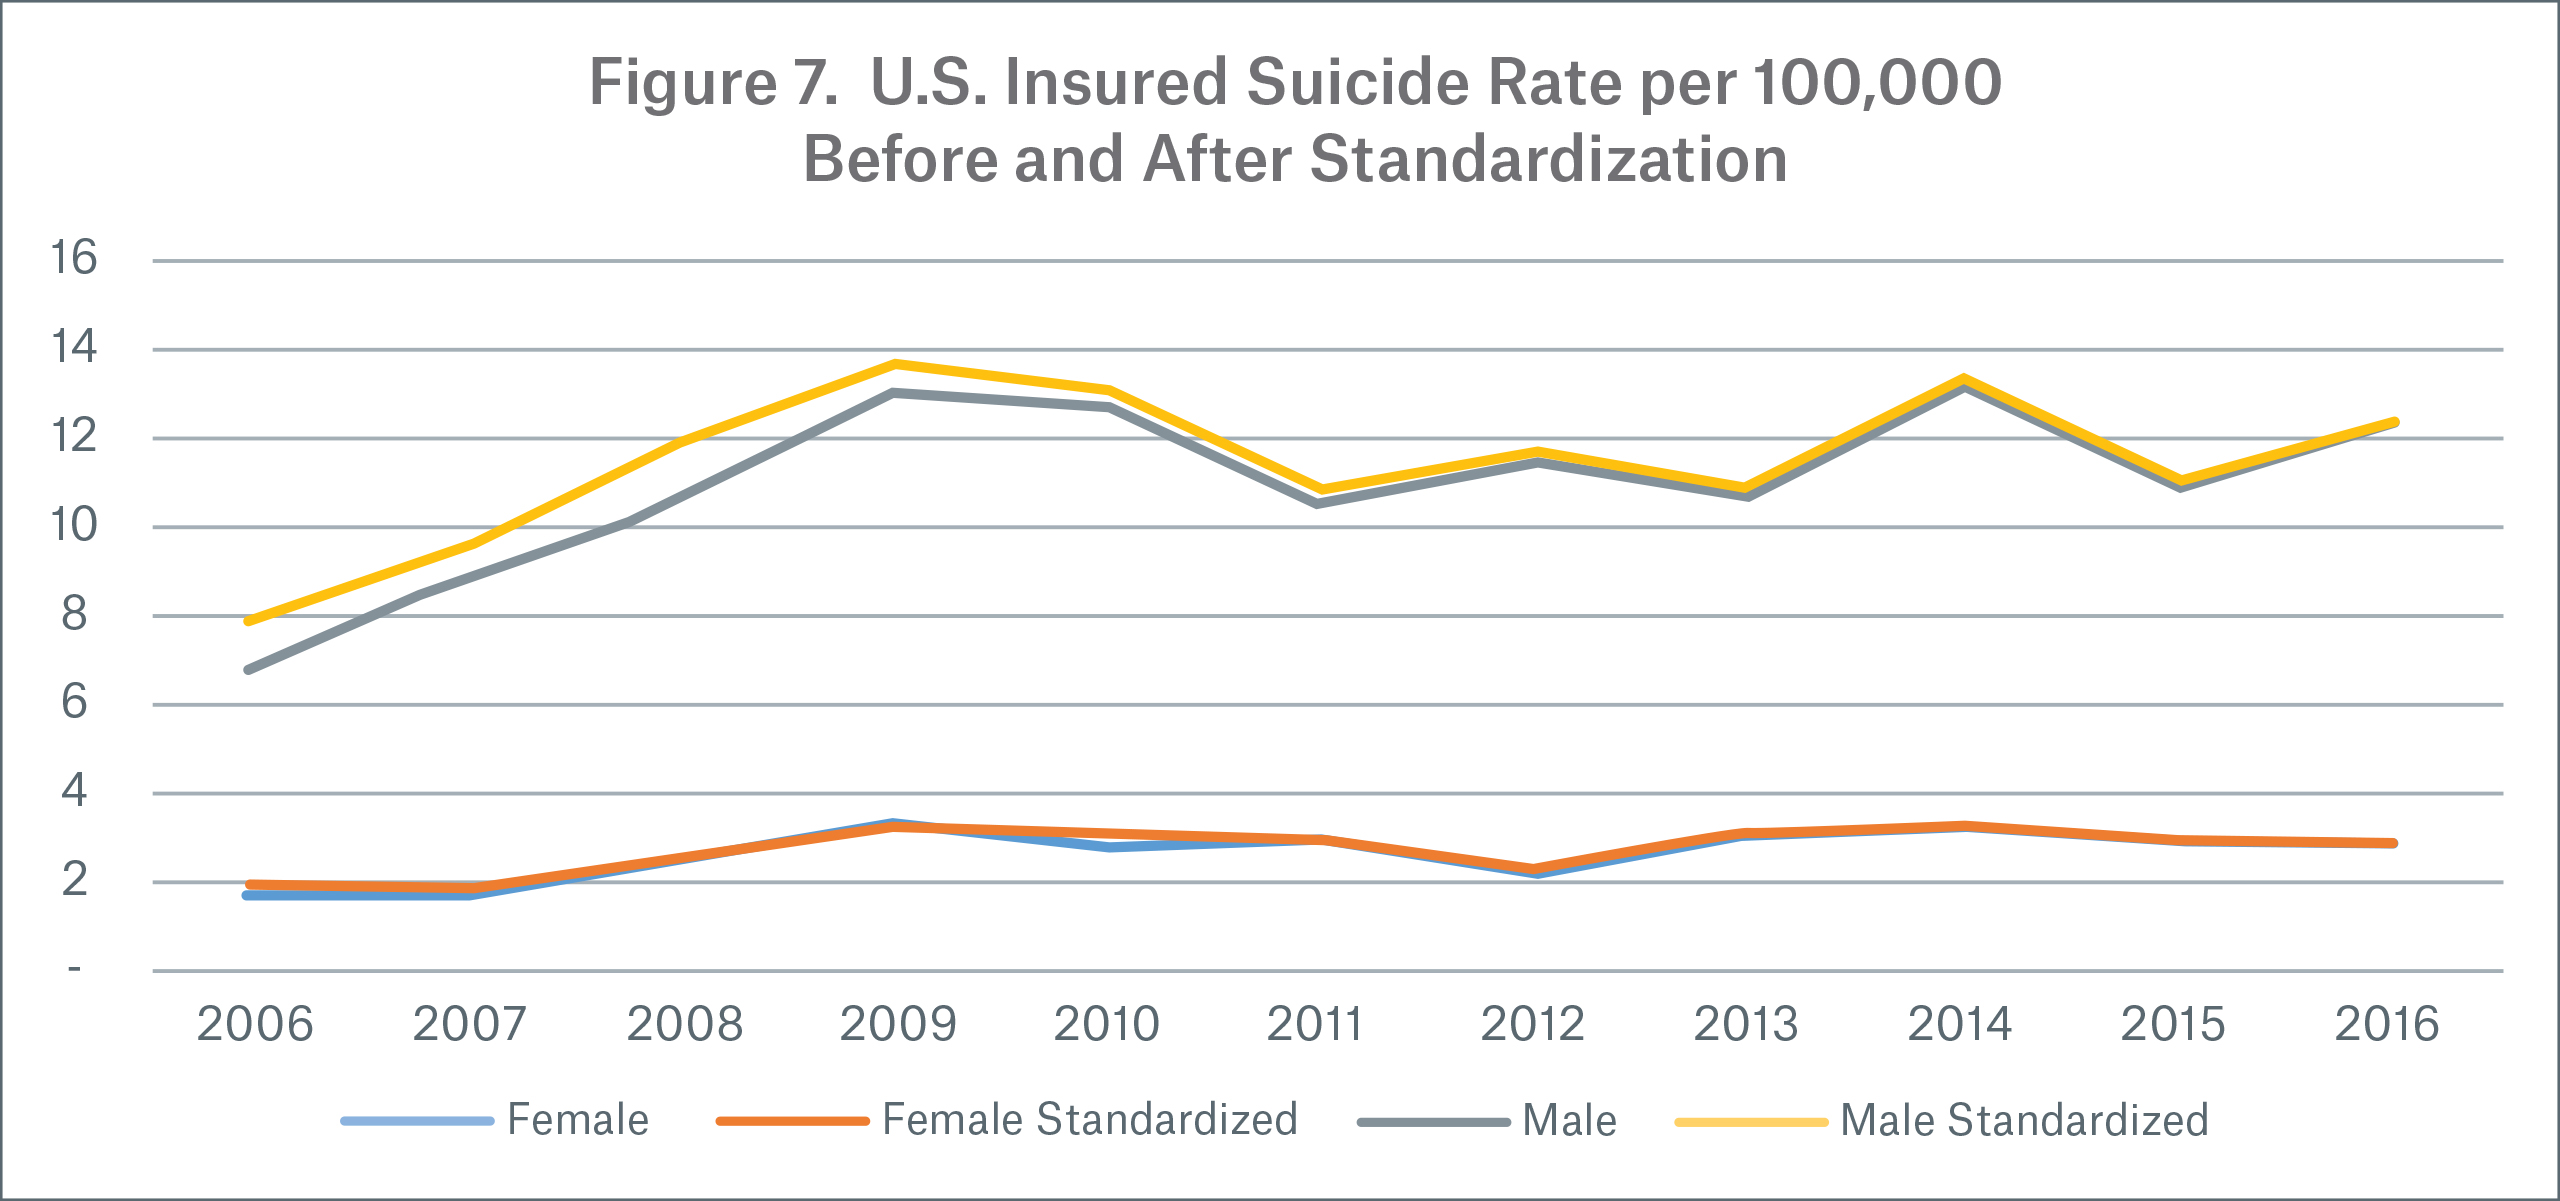
Figure 7 shows that suicide rates standardized to the 2016 age and gender weights are similar to non-standardized rates and are exactly the same in 2016. This is also true for further splits by age and gender, therefore, subsequent figures are not standardized.
Seasonality
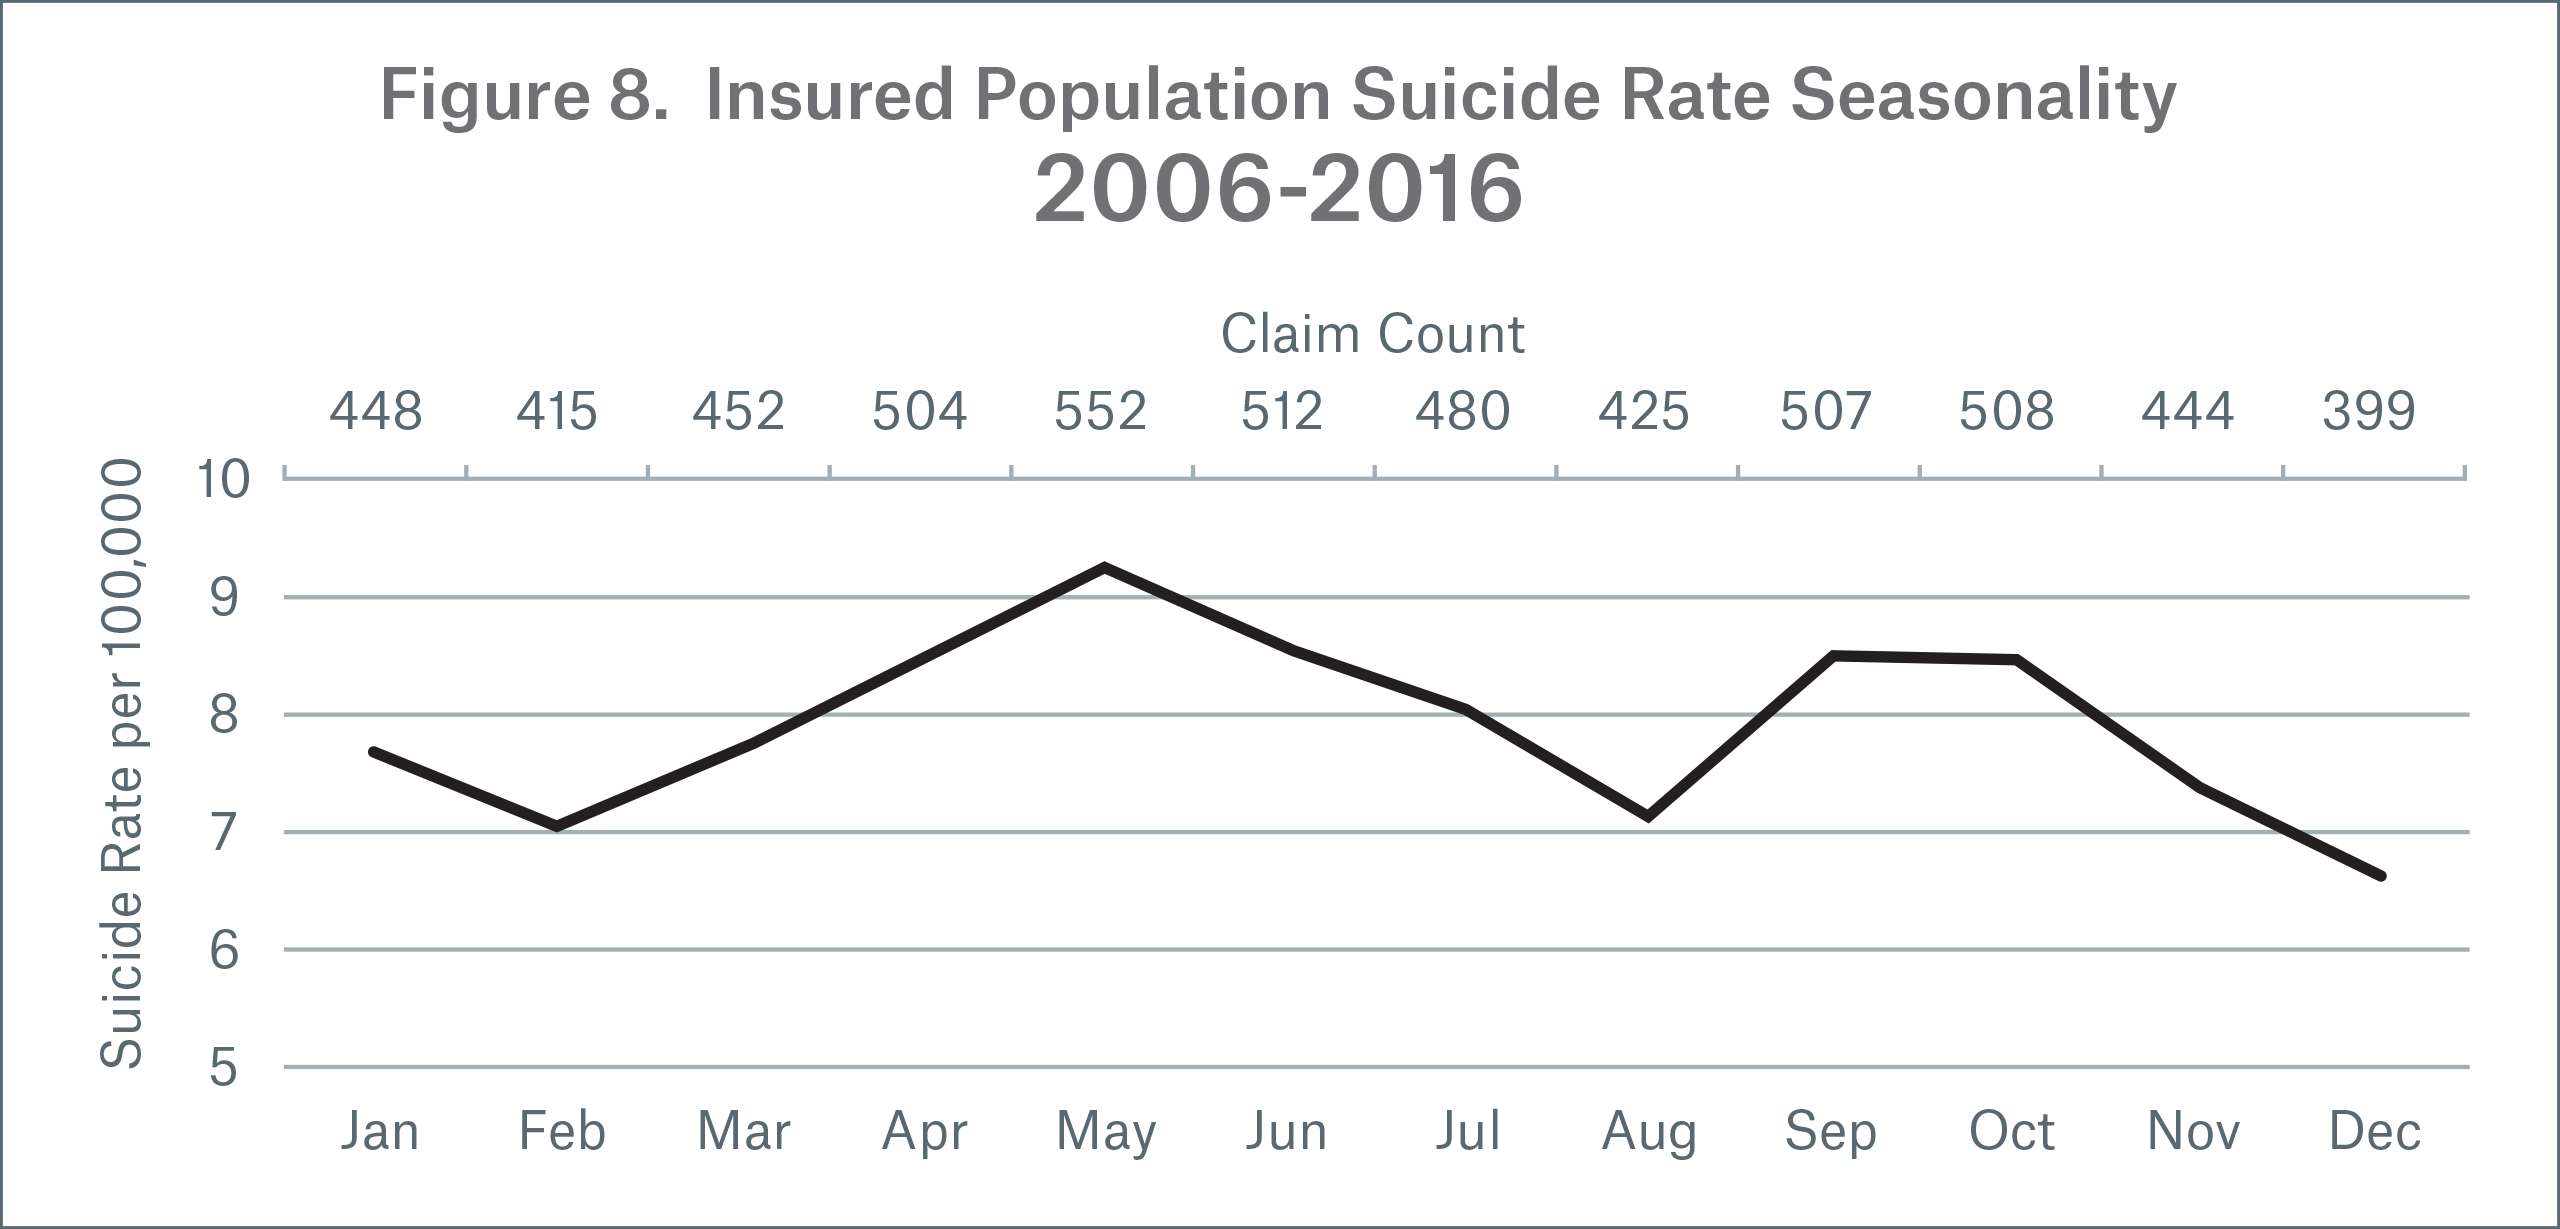
How do suicides vary by month and how are they distributed by calendar quarter? According to the CDC, suicides peak in spring and fall and are lowest in December in the general population.6 From 2006 to 2016, in the general population, 26 percent of the suicides occur in each of the second and third quarters, 24 percent occur in each of the first and fourth quarters. In the insured population (Figure 8), we see a similar monthly pattern with May having the highest suicide rate. Looking by quarter, the insured population experienced a larger seasonal effect with the highest percentage — 28 percent — of suicide claims occurring in the second quarter. 23 percent of suicide claims occurred in the first quarter, 25 percent occurred in the third quarter and 24 percent occurred in the fourth quarter.
Why do we see this seasonality? Some scientists believe there may be a link between suicide and climate change. As early as 1881, there were professionals who cited an increase in suicides during warmer weather, and a recent study links an increase in suicides to rising global temperatures. 7,8
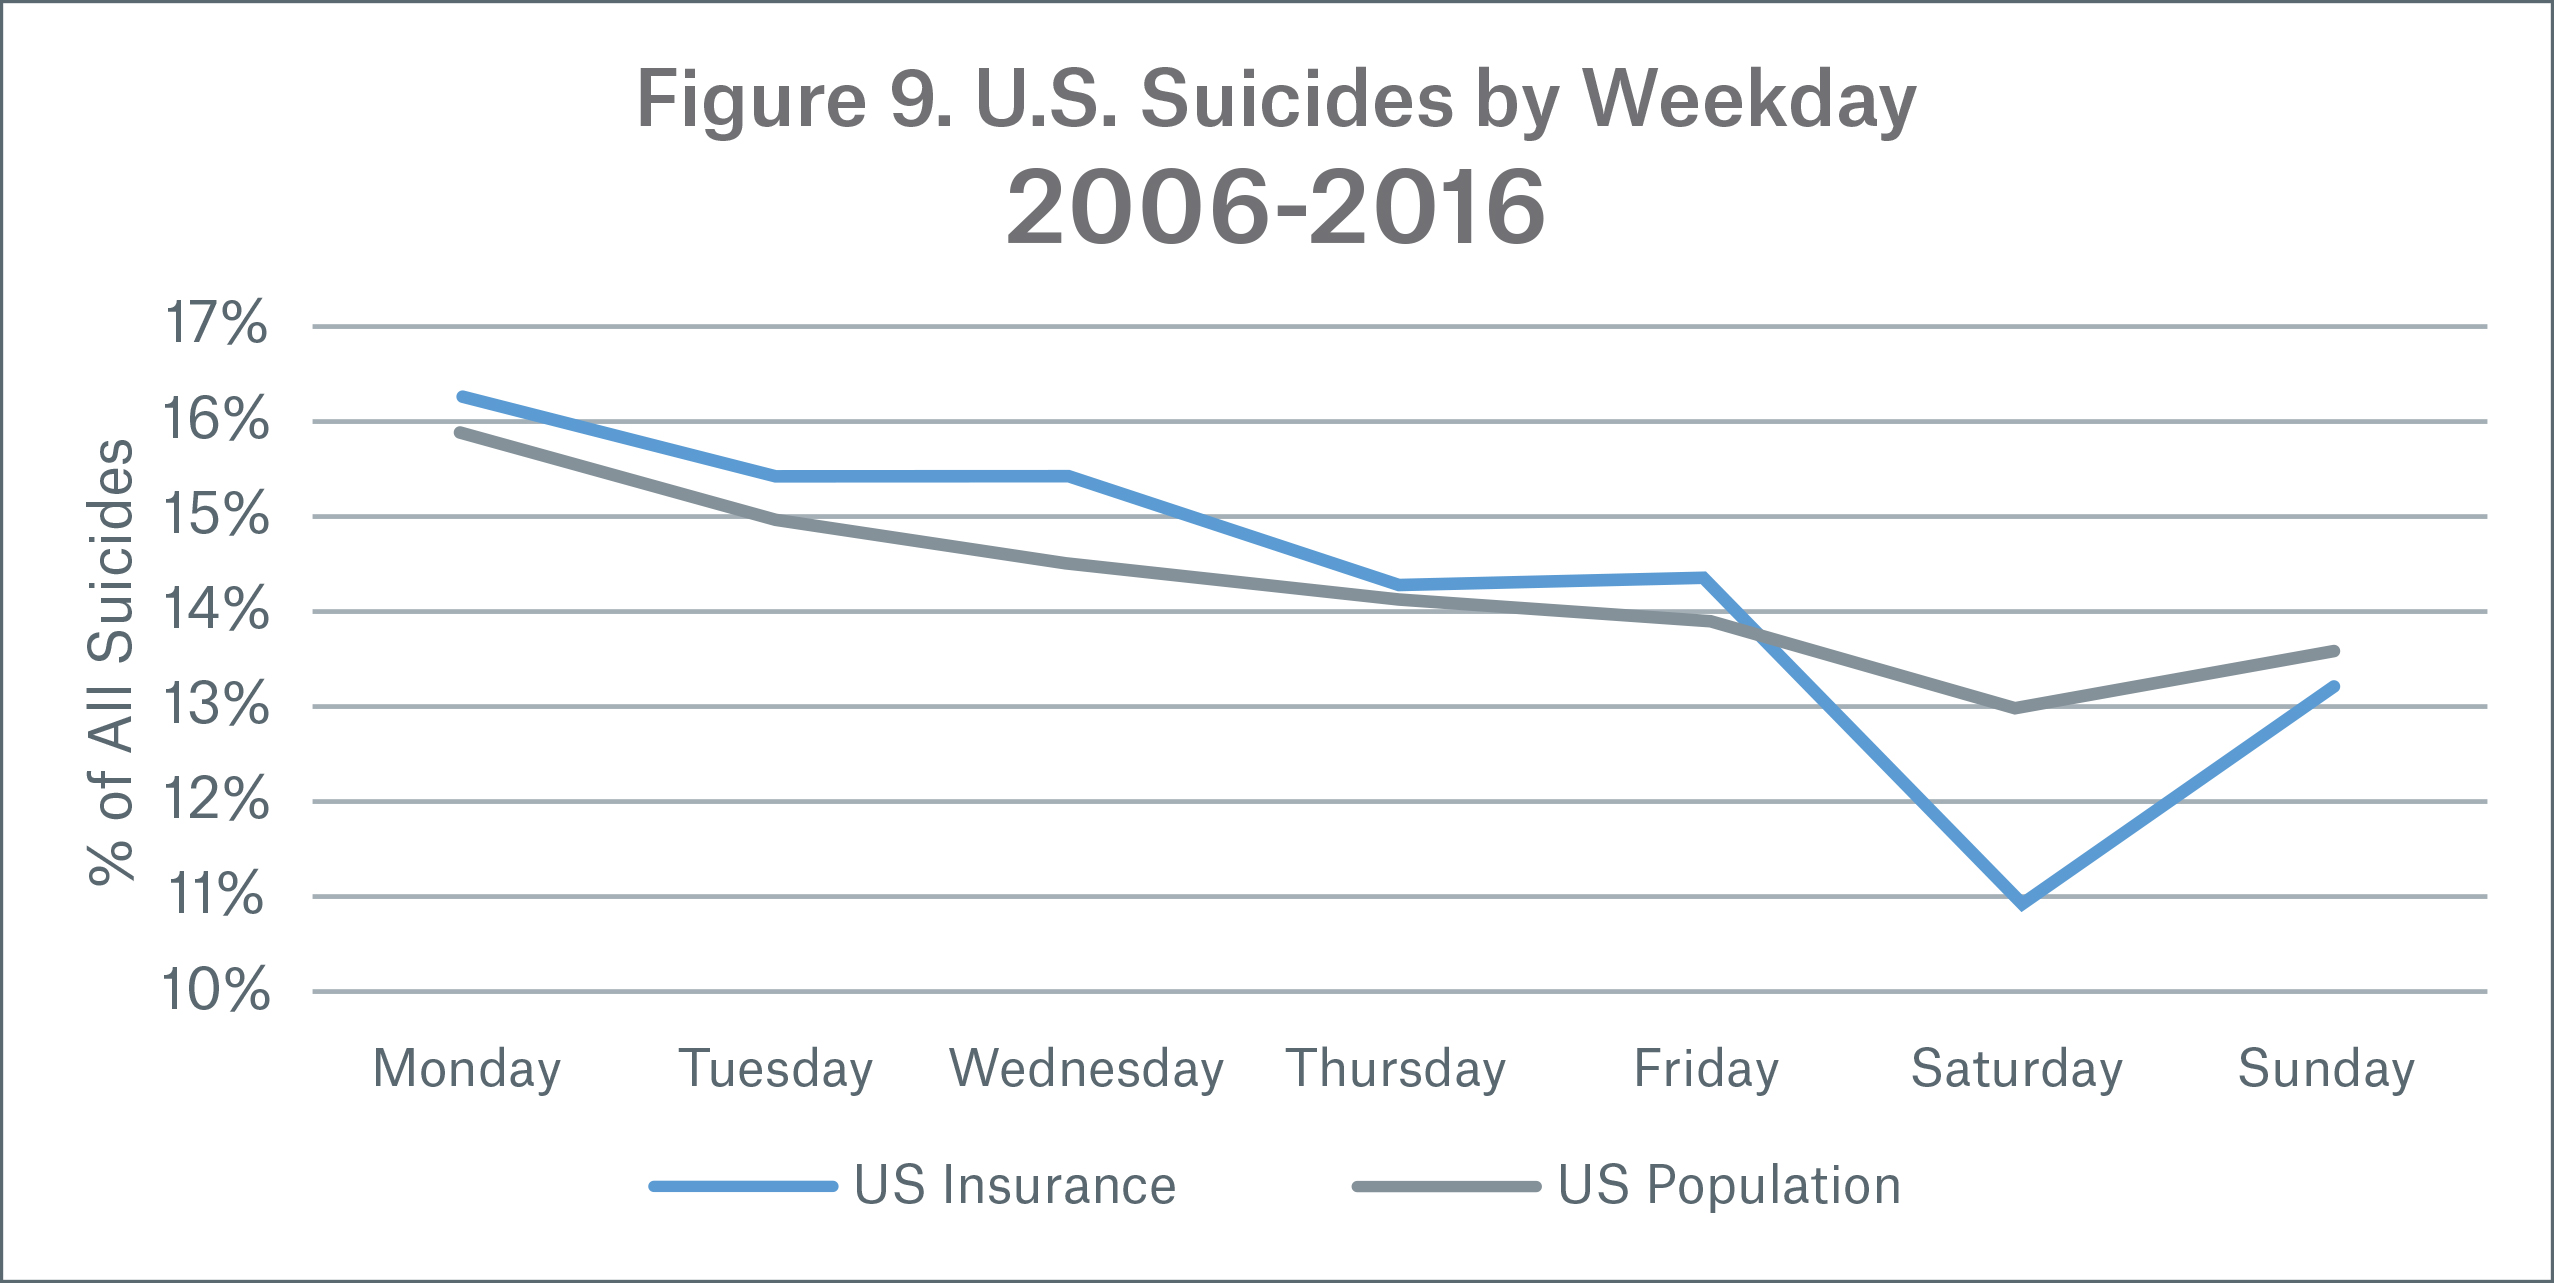
There is also a distinct pattern of suicides by day of the week. As shown in Figure 9, in the general population, more suicides occurred on Monday over the period 2006 to 2016. As the week progresses suicides steadily decrease until the weekend, where they are the lowest. This pattern is similar in the insured dataset but the weekday fluctuation is more extreme. Note: suicides by weekday reflect actual experience and were not standardized.
Which days of the year saw the least and most suicides in the insured dataset? July 4th (Independence Day) has the fewest suicides in the year (0.12 percent) while April 9th has the most suicides in the year (0.56 percent).
Age and gender
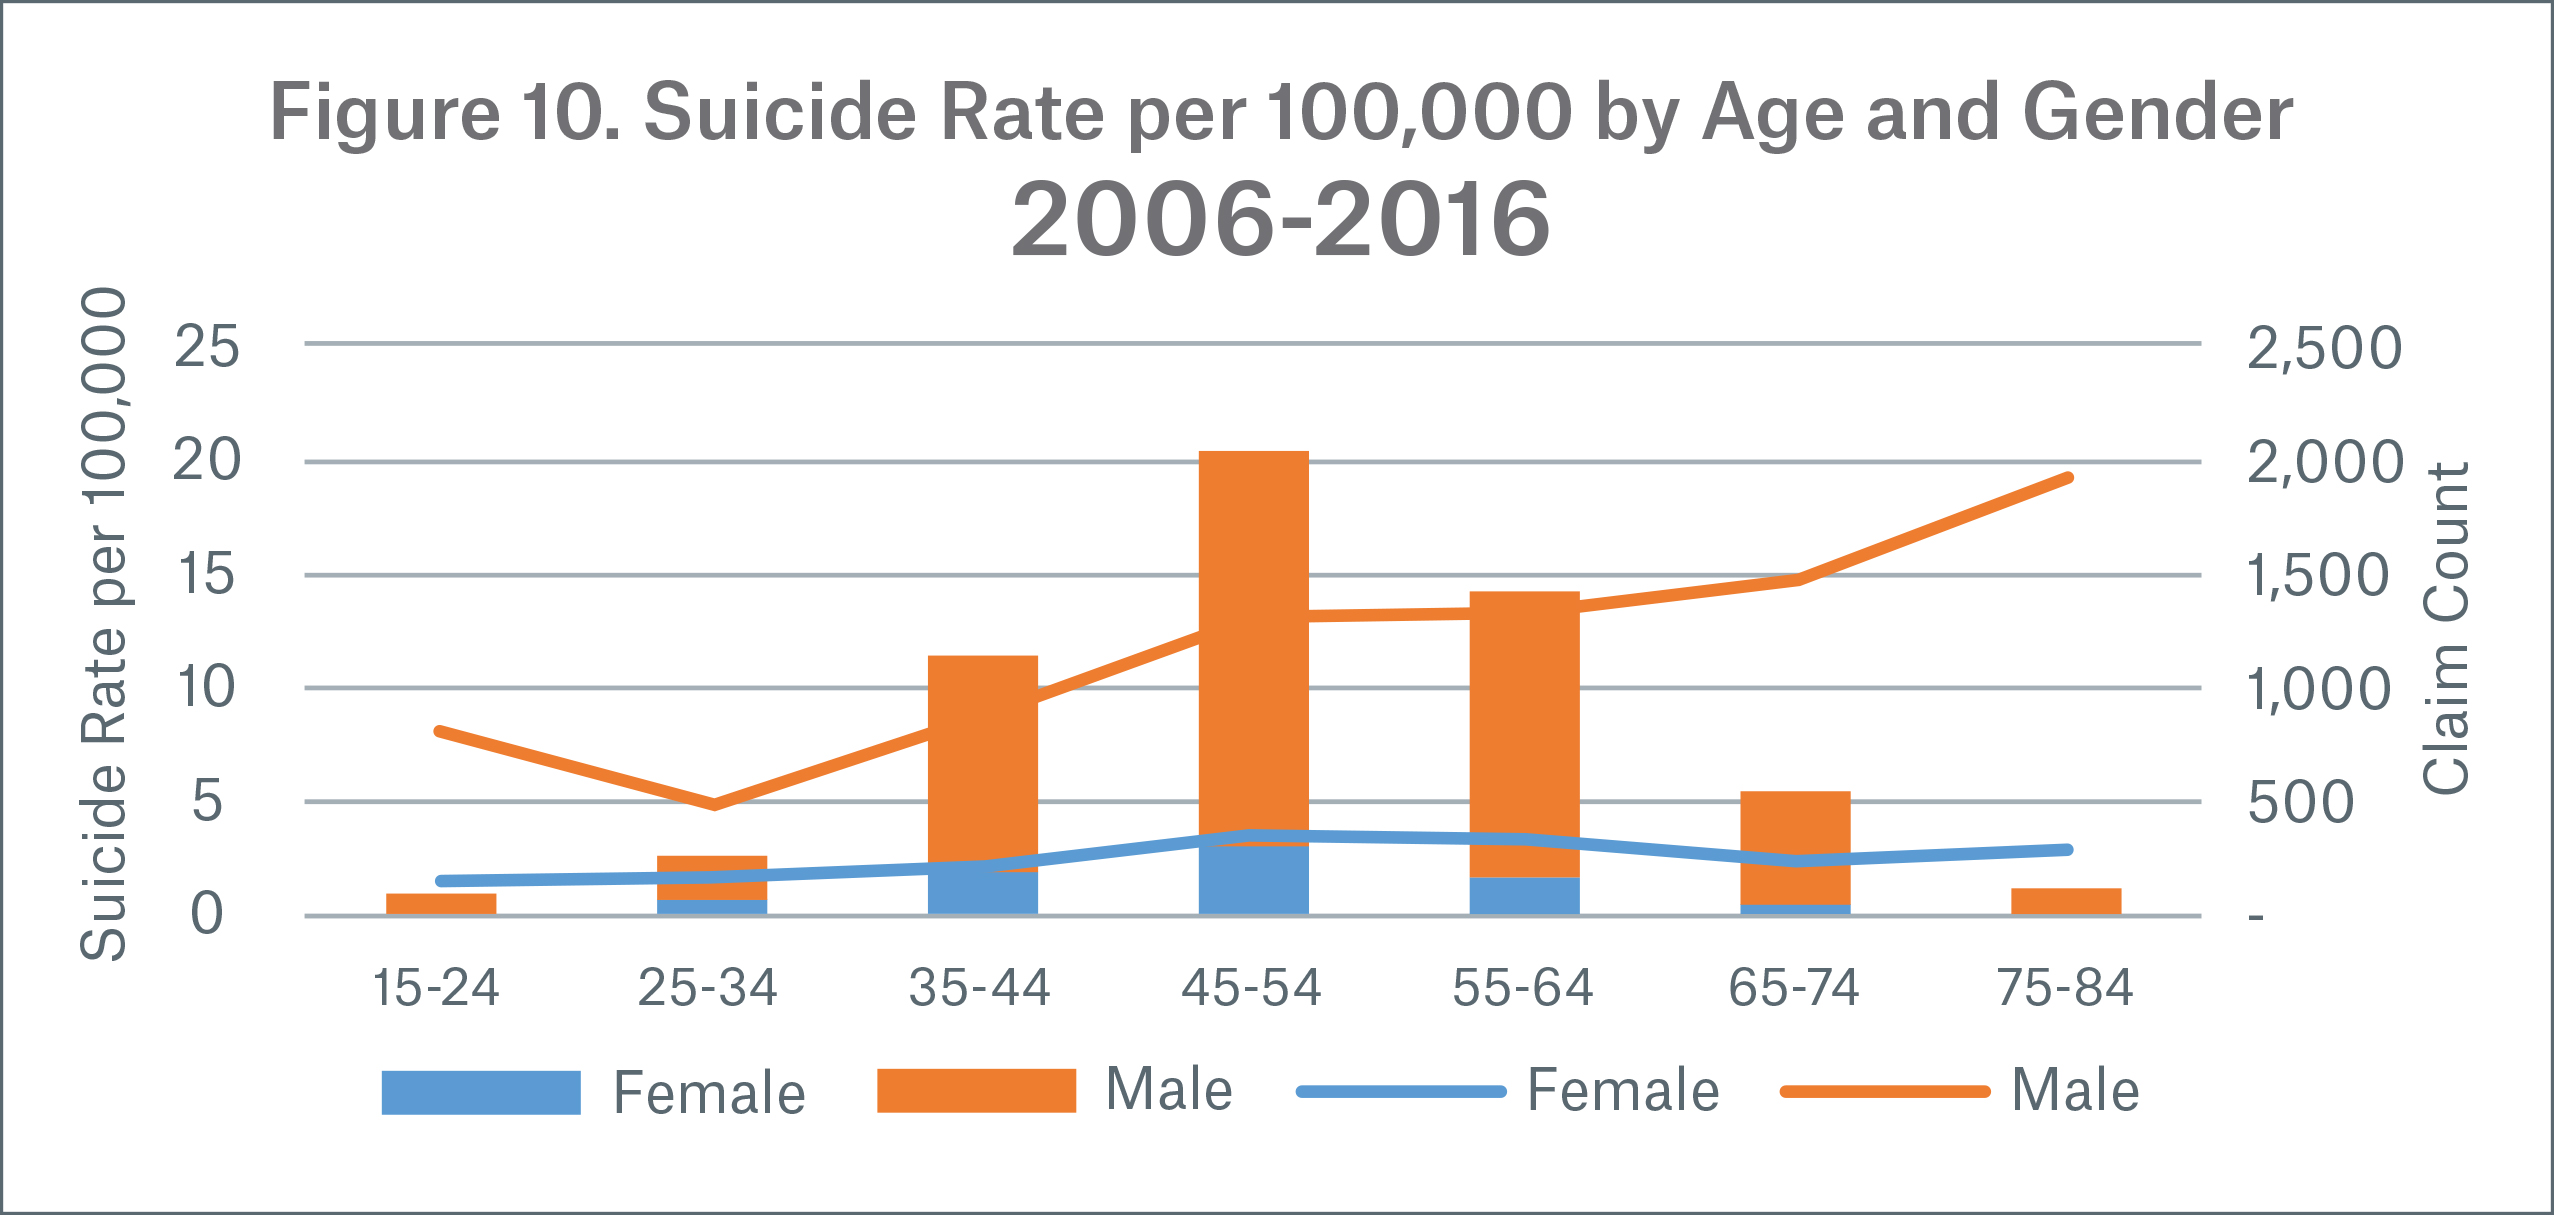
In Figures 10-13, suicide rates are plotted as lines and claim counts as stacked columns.
Suicide rates generally increase with age for males, while rates for females peak at ages 45-54, creating a gap in later ages. This pattern is consistent with the U.S. general population pattern we saw earlier, except that suicide rates in the insured population increase with each age group after age 24, whereas in the general population suicide rates decrease between ages 45 and 74.
Note: There are limited claims at younger and older ages as well as for females in general.
Duration and gender
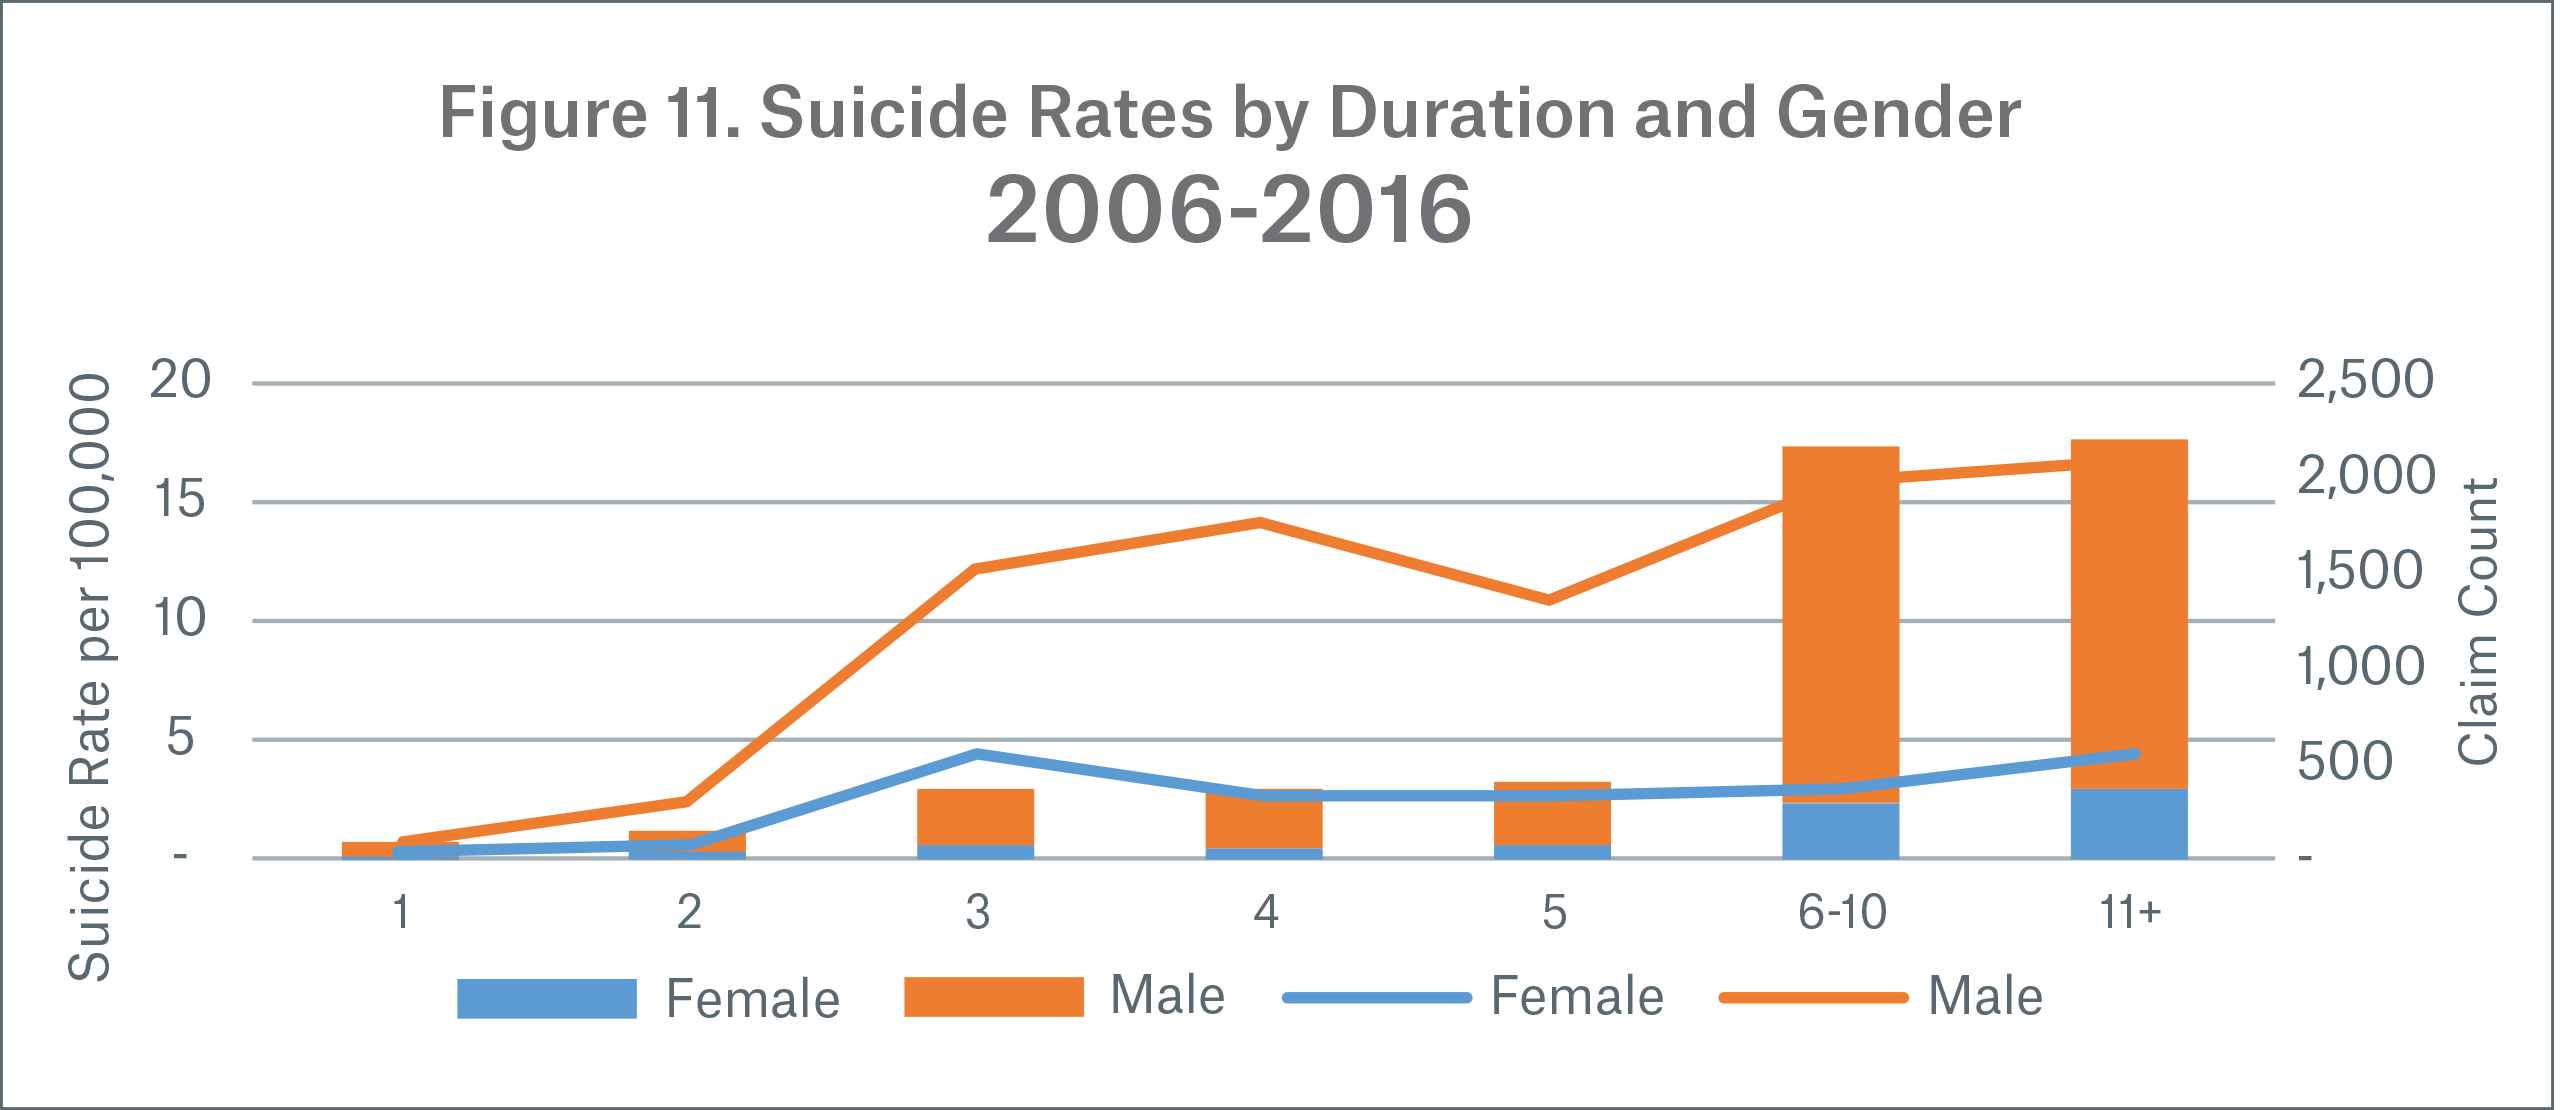
Figure 11 shows suicide rates by face amount instead of count.
Suicide rates are lower in policy durations one and two due to contractual suicide exclusions, which typically cover these durations. Some contracts have a one-year suicide exclusion, but these are less common. Since suicide rates are based on paid claim amounts there is a dramatic increase in rates after the exclusion period. Particularly in durations one and two, amounts paid on suicide reflect return of premium.
Male suicide rates show an increasing pattern by duration while female suicide rates are fairly flat. The increasing male pattern is consistent with the increasing pattern for higher attained ages we saw earlier, as age is correlated with duration.
Face band, gender and attained age
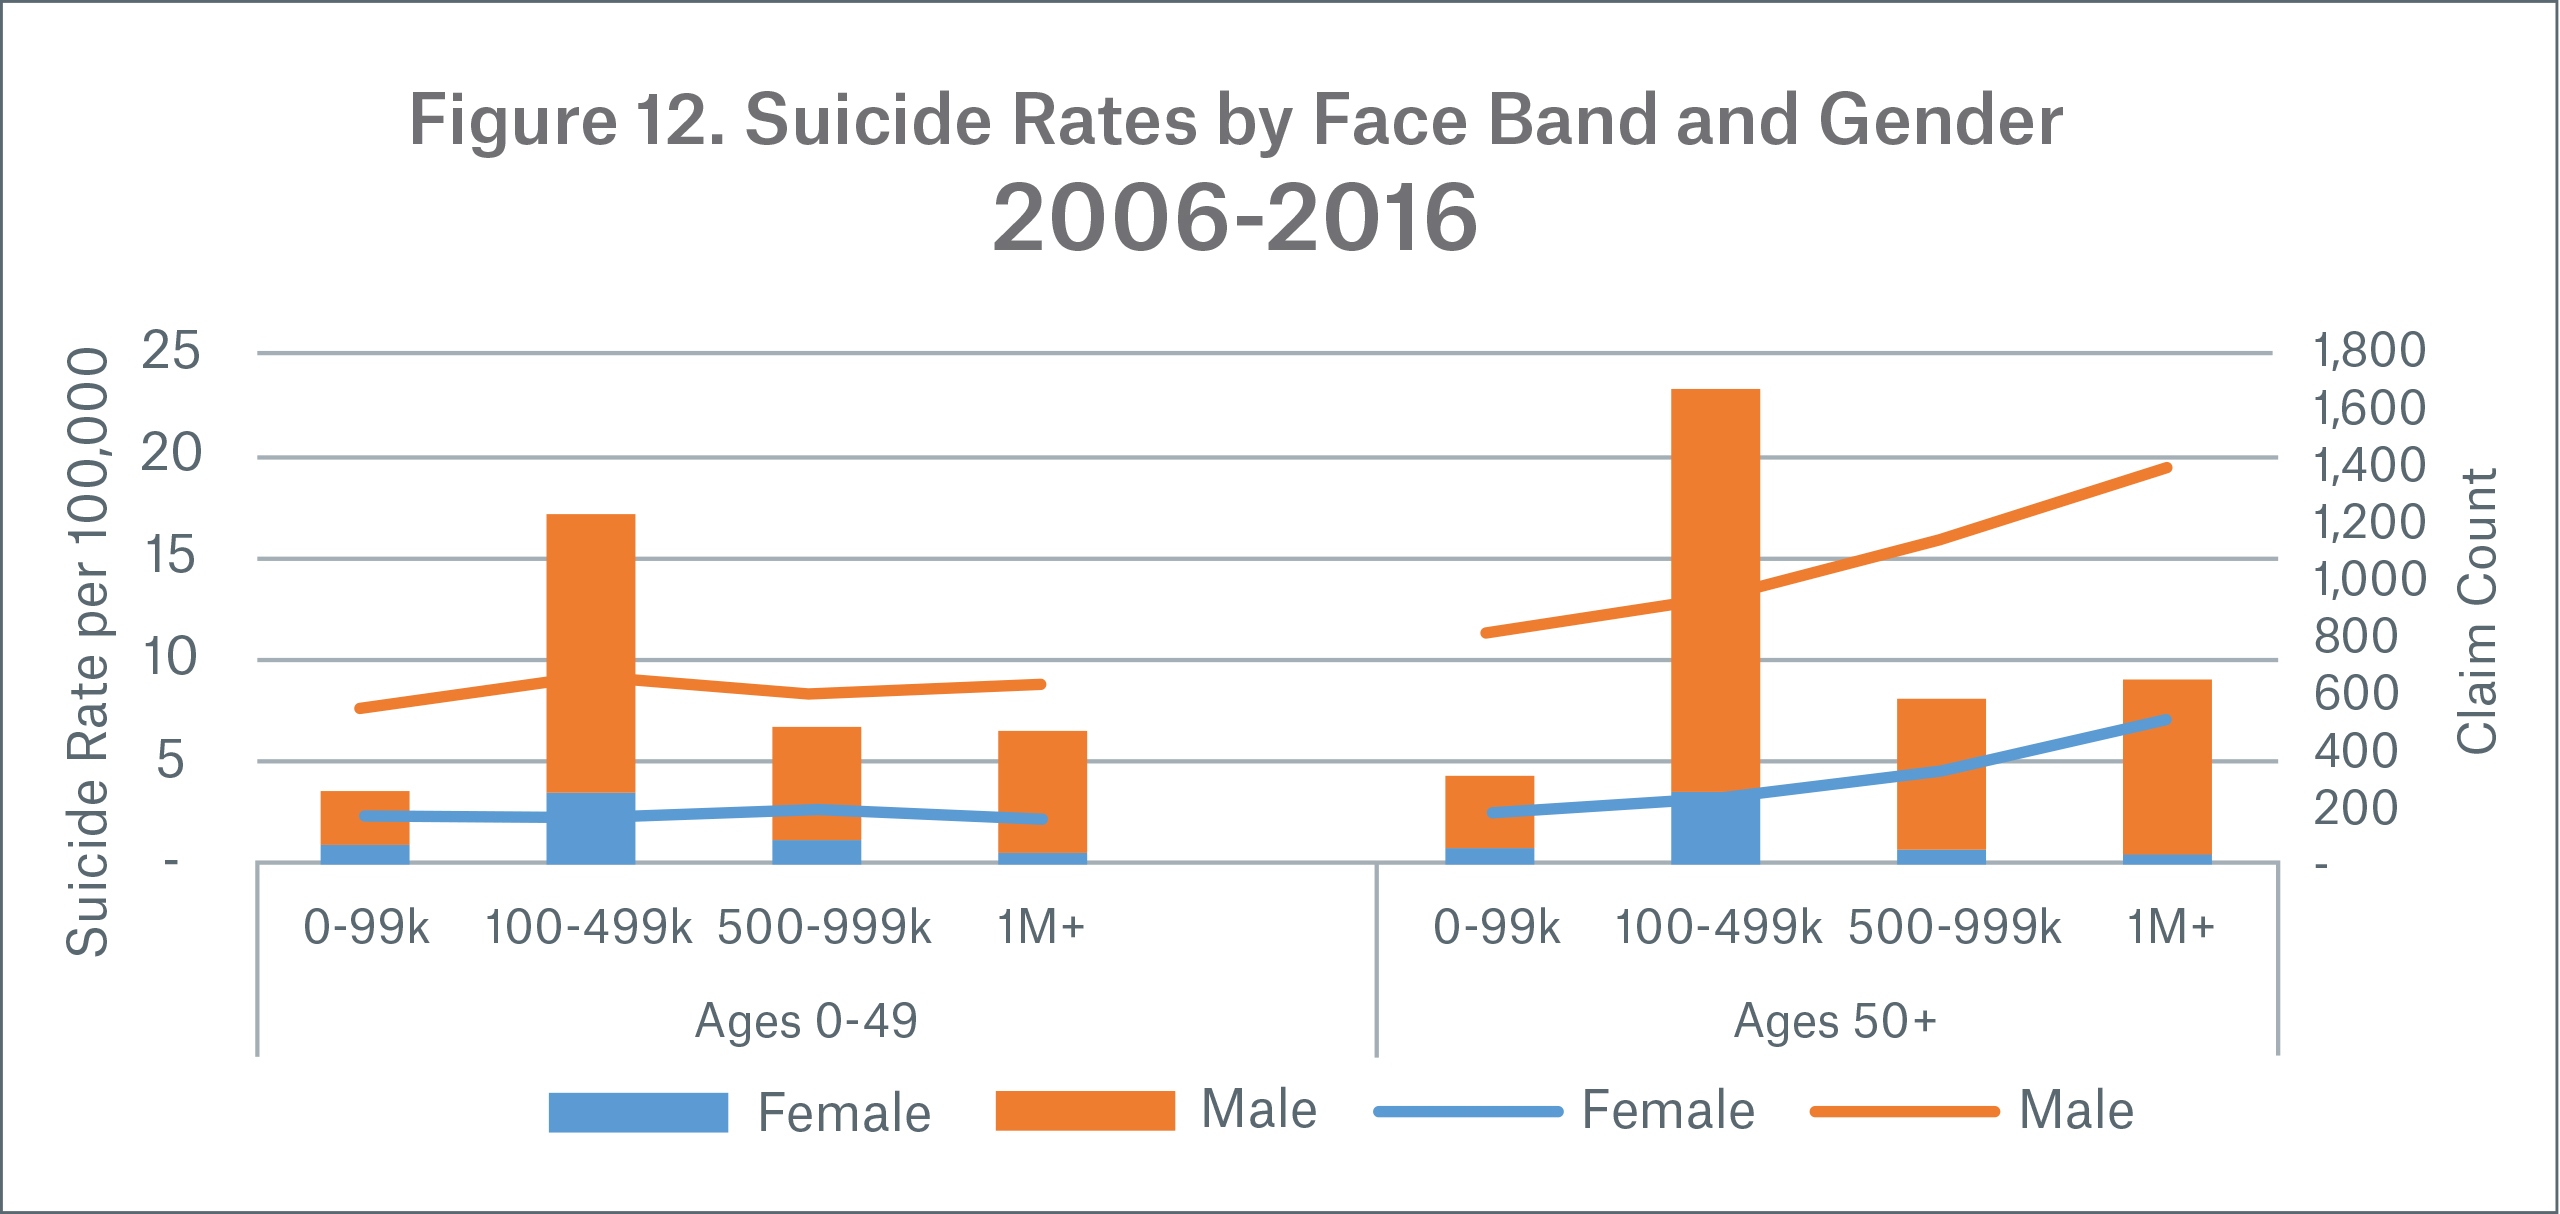
Earlier we saw suicide rates are 17 percent higher if suicide rates are determined by face amount instead of count, indicating that those who buy more insurance tend to commit suicide at a higher rate.
In Figure 12 we see that the relationship between suicide rate and face band amount varies by age; ages 0-49 are flat, while age 50+ suicide rates increase with each face amount band for both genders. The largest increase in suicide rate is between $500,000-$999,999 and $1 million+.
Product
In Figure 13, data for durations 11 and above were excluded. This was done to avoid understating the suicide rate for shorter level period products, which have more exposure to the low suicide rates in durations one and two.
.jpg/_jcr_content/renditions/original./Fig-13_suicide%20rate%20by%20product%20(durations%201-10).jpg)

Tobacco & gender
A recent meta-analysis found that those who were currently smokers (defined as individuals who have smoked at least 100 cigarettes ever and have smoked at least once in the last 30 days) were “associated with an increasing risk of suicidal behaviors” and that it was “a contributing factor to suicide.” The same study found a relative risk of suicide death for current smokers compared to non-smokers of 1.83 (95% CI: 1.64, 2.02;
14 studies; I2 = 49.7%; P = 0.018).9
Results from Munich Re’s study also found smoking was correlated with increased suicides. A comparison of suicide rates (Figure 14) shows tobacco suicide rates are 2.4x higher for females and 1.8x higher for males compared to non-tobacco users of the same gender. These results are similar to the relative risk of suicide death found in the meta-analysis. However, suicide rates for female tobacco users is an area of uncertainty due to the low claim count (110 claims).
Preferred class
Suicide rates were standardized by age and gender within each preferred class group to improve the comparison. This was done as females and younger ages tend to qualify for better preferred classes more often. We will focus on preferred class groups for non-tobacco users only. In the table below preferred class 1 is the best class while higher classes are worse.
Suicide rates increase by preferred class except in the 2-class system, where the less-preferred class exhibits a lower suicide rate. In the 3- and 4-class systems, suicide rates are cleanly segmented by preferred underwriting and can vary from 6.9 to 10.0 per 100,000 from the best to worst class in a 4-class system.
Conclusion
In this paper we demonstrated how general population suicide trends translate into the insured population and how suicide rates vary in the insured portfolio. We achieved this by performing a study on public data sources and our internal suicide mortality database. To get a clearer view from an insurer’s perspective, we enhanced population and insured suicide rate comparisons by standardizing them by age and gender. We then summarized our key findings to assist insurers in better understanding how suicide rates compare to the population and may vary in their own portfolio.
This paper is the first in a series on the life insurer’s perspective of suicide mortality. The focus of this paper has been on analyzing data and statistics and is intended to lay a foundation for subsequent papers that will bring claims and underwriting insights to the analysis.
- Centers for Disease Control and Prevention, National Center for Health Statistics. (2019, January 27). Underlying Cause of Death. Retrieved from CDC Wonder: http://wonder.cdc.gov/ucd-icd10.html
- World Health Organization. (2019, February 2). Suicide. Retrieved from World Health Organization: https://www.who.int/news-room/fact-sheets/detail/suicide
- Centers for Disease Control and Prevention. (2019, February 2). Suicide rising across the US. Retrieved from Centers for Disease Control and Prevention Vital Signs: https://www.cdc.gov/vitalsigns/suicide/index.html
- Statistics Canada. (2018, August 7). Population estimates on July 1st, by age and sex. Retrieved from Statistics Canada: https://www150.statcan.gc.ca
Deaths and age-specific mortality rates, by selected grouped causes. Retrieved from Statistics Canada: https://www150.statcan.gc.ca - Society of Actuaries. (2019, February 2). US Population Mortality Observations - Updated with 2016 Experience. Retrieved from US Population Mortality Observations: https://www.soa.org/research-reports/2017/population-mortality-observations/
- Centers for Disease Control and Prevention. (2019, February 2). Holiday Suicides: Fact or Myth. Retrieved from CDC: Violence Prevention: https://www.cdc.gov/violenceprevention/suicide/holiday.html
- Meyer, R. (2019, February 2). New Study: Climate Change Will Cause Suicides to Spike. Retrieved from The Atlantic: https://www.theatlantic.com/science/archive/2018/07/high-temperatures-cause-suicide-rates-to-increase/565826/
- Marshall Burke, F. G.-N. (2019, February 2). Higher temperatures increase suicide rates in the United States and Mexico. Retrieved from Nature Climate Change: https://www.nature.com/articles/s41558-018-0222-x
- Poorolajal, J. &. (2016). Smoking and Suicide: A Meta-Analysis. Plos One, 11 (7). doi:10.1371/journal.pone.0156348
Printer-friendly version
Contact the Author:
/Colin%20Sproat.jpg/_jcr_content/renditions/original./Colin%20Sproat.jpg)
Related Content
Newsletter
properties.trackTitle
properties.trackSubtitle
